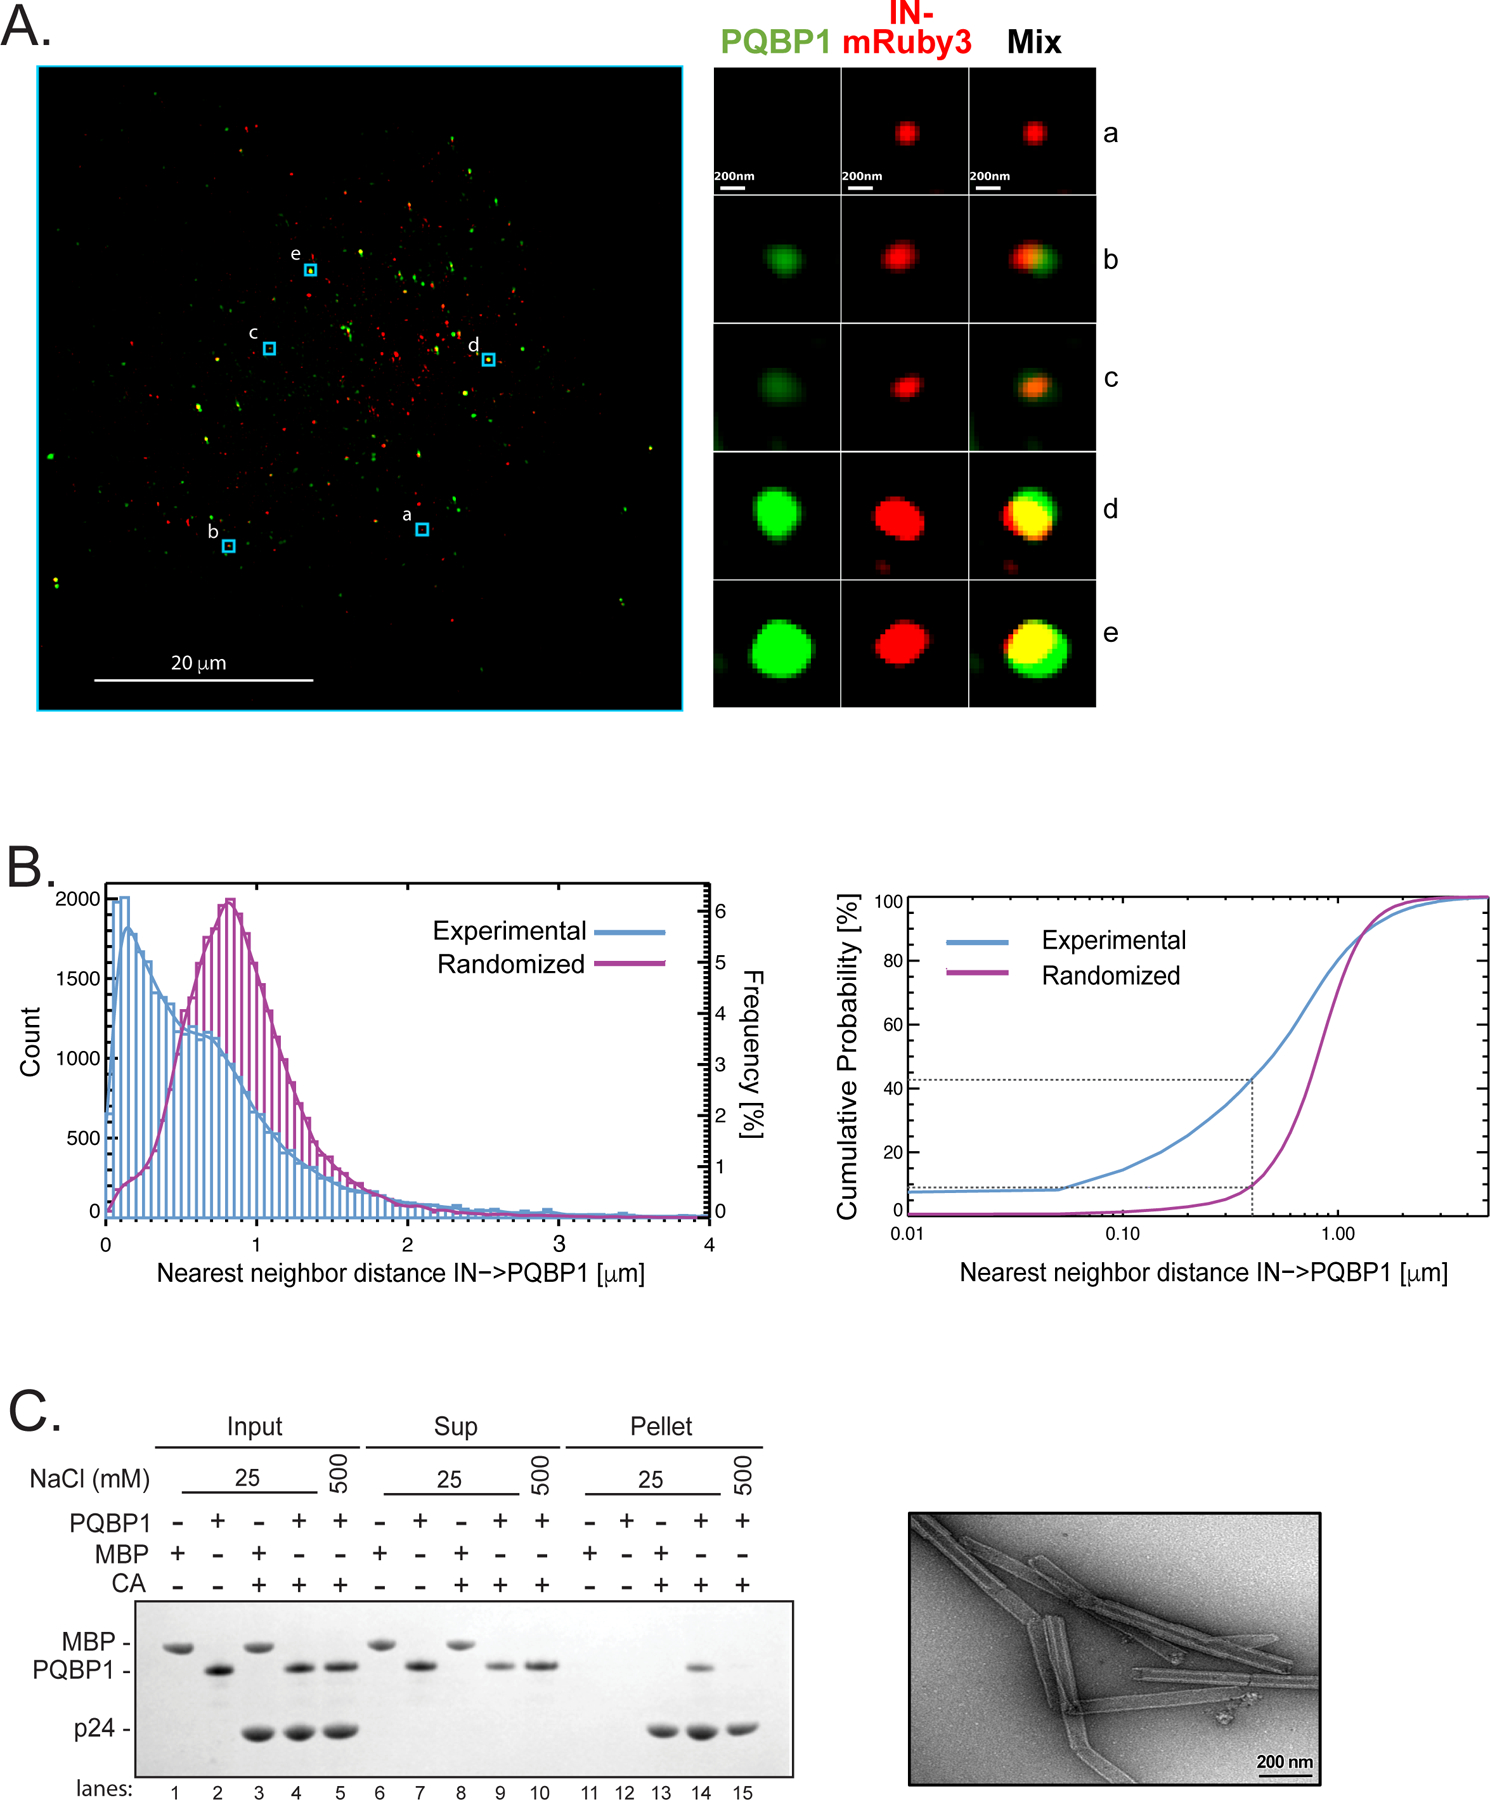
Figure 1. PQBP1 colocalizes with capsid of incoming virions during the early steps of infection.

(A) Single Z image of PMA-differentiated THP-1 cells (PMA-THP-1) infected with HIV-1 virions labeled with Gag-IN-mRuby3 (red). Viral fusion was synchronized and, one-hour post-infection, immunostaining of PQBP1 protein (green) was performed. Zoomed images of individual viral particles associating with PQBP1 are shown on the right. Scale bars: 20 μm and 0.2 μm, left and right respectively. (B) Left, distribution of IN-PQBP1 nearest neighbor distances (Count). The distribution of experimental data (blue histogram) is compared with the one generated by in silico randomized dots (magenta histogram). A kernel density estimate of each distribution is overplotted as a solid curve, represented as Frequency, N=32,033 INs. Right, the cumulative probability of nearest neighbor distance (d) measures the percentage of IN dots that have PQBP1 within a defined d. For example, the percentage of INs that have PQBP1 at d < 0.4 µm is a 43% for experimental data and 9% for randomized dots, as highlighted by grey dotted lines. (C) CA tube co-pelleting assay. Insoluble cross-linked CA A14C/E45C tubes were incubated together with PQBP1 or maltose binding protein (MBP) and separated into supernatant (Sup) and pellet fractions, then analyzed by reducing SDS-PAGE. The data are representative of at least three independent experiments. Scale bar, 0.2μm. See also Figure S1.
