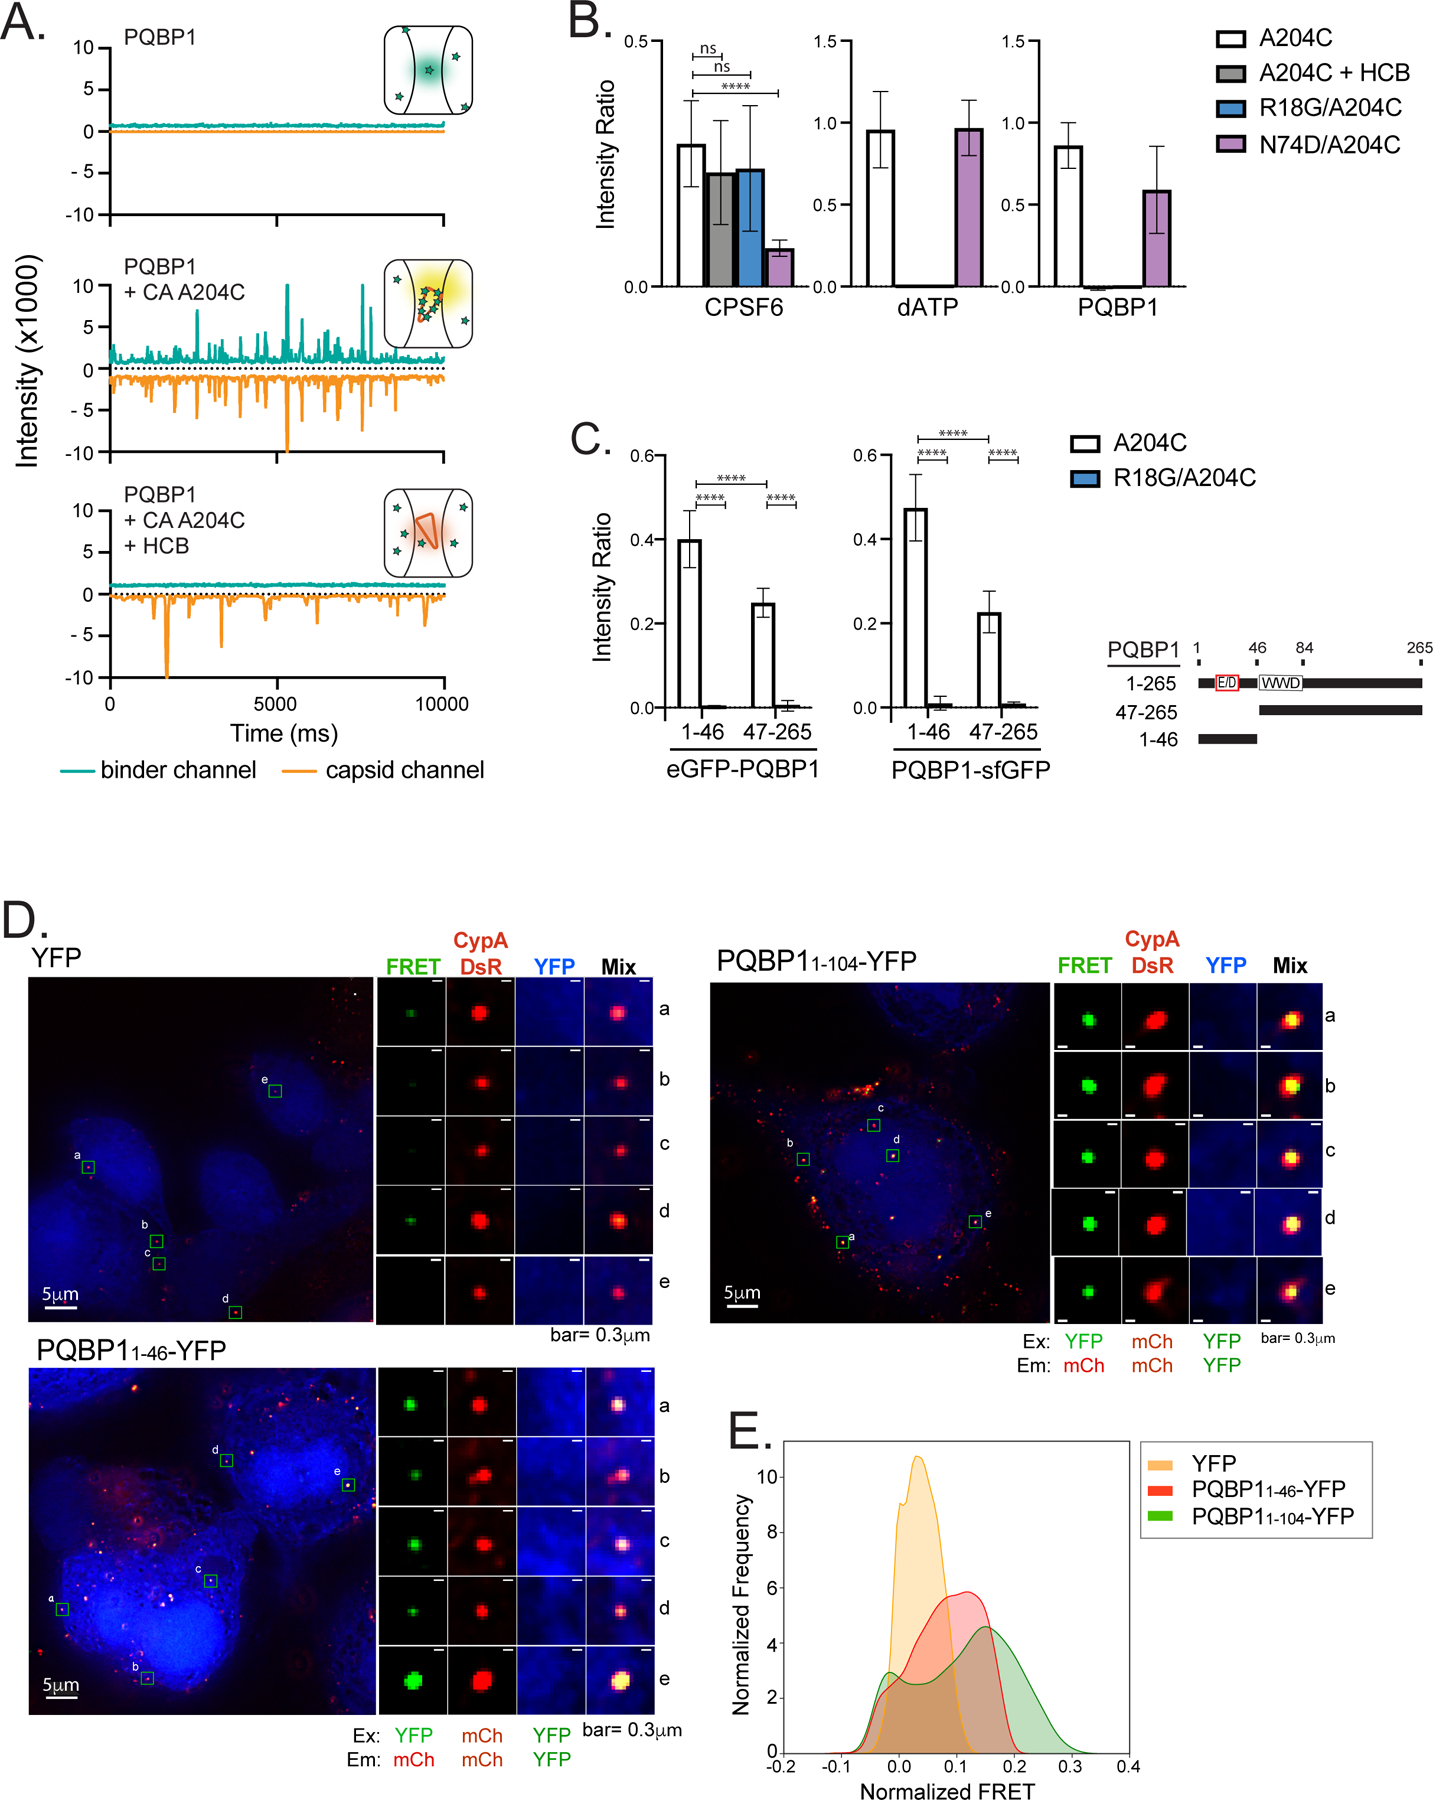
Figure 2. PQBP1 directly interacts with HIV-1 capsids through its amino-terminus.

(A) Representative TCCD traces of AF488-PQBP1 (green) and AF568-labeled CA (A204C) particles (orange). The insets show schematics of the species detected by TCCD, with PQBP1 and CA (A204C) particles represented as green stars and orange cones, respectively. Top, featureless PQBP1 trace due to the diffusion of PQBP1 monomers; middle, coincident peaks in both traces due to codiffusion of multiple PQBP1 molecules bound to CA particles; bottom, featureless PQBP1 trace due to non-associated diffusion of PQBP1 monomers and CA particles in the presence of hexacarboxybenzene (HCB). (B) PQBP1 binds to the R18 pore of the capsid. TCCD analysis of AF488-PQBP1, AF488-CPSF6313–327 peptide and fluorescein-dATP to CA (A204C) particles in the absence and presence of HCB, and to R18G or N74D capsids. (C) The N-terminal 46 residues of PQBP1 bind strongly to capsid. TCCD binding analysis of GFP fusions with PQBP11–46 and PQBP147–265 to CA (A204C) particles in the absence and presence of HCB. Data are representative of at least two independent experiments. One-way ANOVA, **** p<0.0001, ns=no significance. (D) and (E) Fluorescence resonance energy transfer (FRET) assay to visualize interactions between PQBP1 and capsid of incoming virions. PMA-THP-1 cells stably expressing either eYFP, PQBP11–46-eYFP or PQBP11–104-eYFP (blue) were infected with HIV-1 packaged with CypA-DsRed (red) for 1.5 hours, followed by PFA fixation, imaging, and FRET analysis. Representative images (D) and distributions of FRET values normalized against an uninfected counterpart (E) were shown (see Star methods for details). FRET excitation and emission wavelengths for YFP and mCherry are as annotated. R0 calculated to be 60.98Å (https://www.fpbase.org/fret/). Data are representative of at least two independent experiments. Scale bars: 5 μm and 0.3 μm, as indicated. See also Figure S2.
