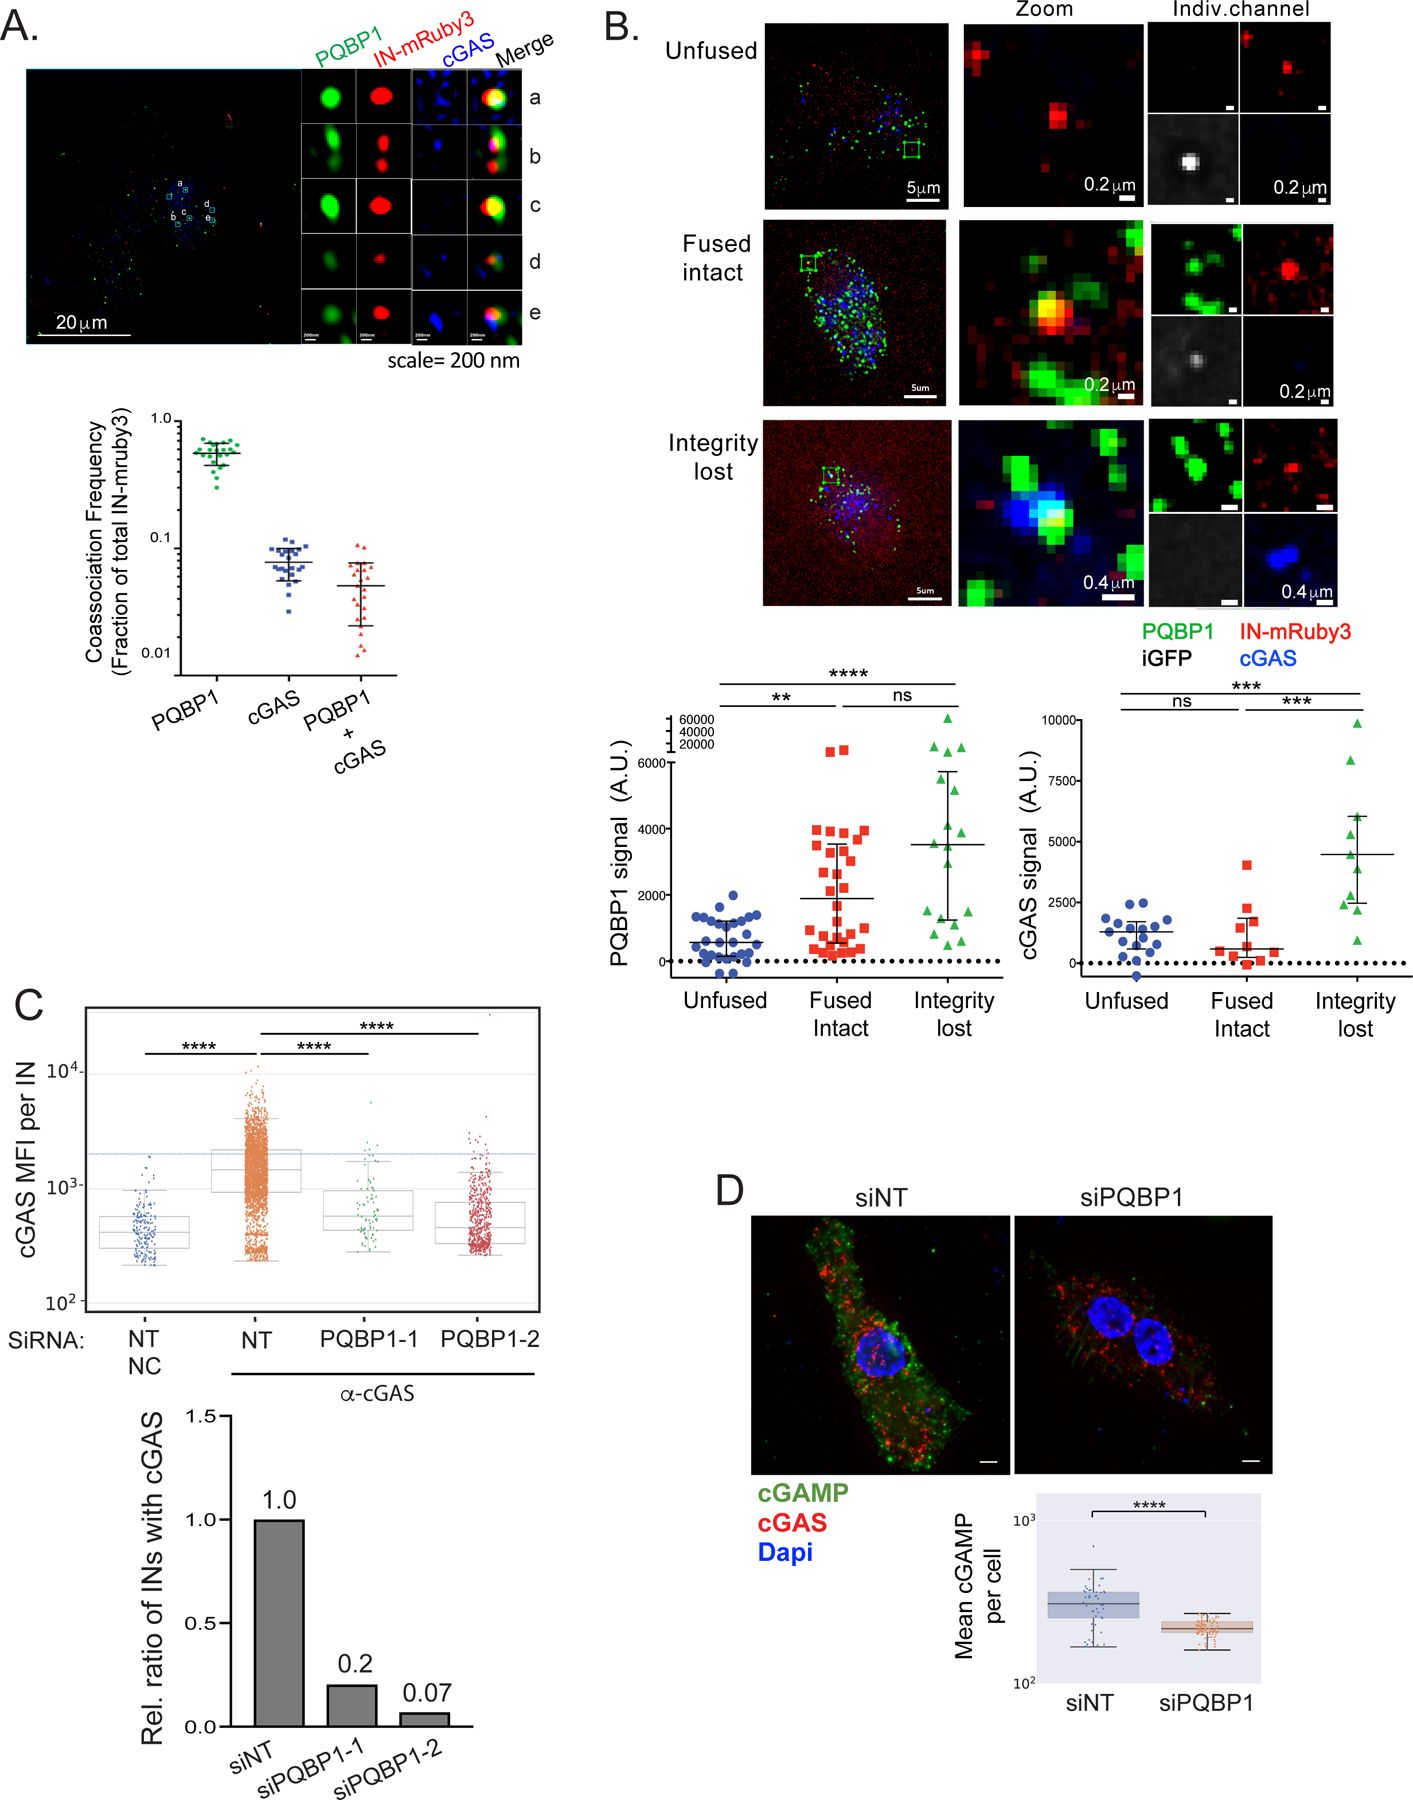
Figure 3. PQBP1 is required for cGAS recruitment to incoming virus particles.

(A) cGAS and PQBP1 association with incoming viral particles. Single Z slice images of PMA-THP-1 cells infected with HIV-1 labeled with Gag-IN-mRuby3 (red) in the presence of VLP-Vpx coinfection for 1 hr, followed by antibody detection of PQBP1 protein (green) and cGAS (blue). Detailed, cropped images of individual viral complexes associating with PQBP1 and cGAS at different levels and distributions are shown on the right. Scale bars: 20 μm (left) and 0.2 μm for panels a to e. Fractions of total IN-mRuby3 foci showing association with PQBP1, cGAS and PQBP1 plus cGAS are quantified at the bottom. (B) PQBP1 recruitment to viral particles precedes cGAS recruitment. MDDCs were infected with HIV-1 labeled with iGFP fluid phase marker and IN-mRuby3 at low MOI and subjected to time-lapse imaging for an hour, followed by fixed IF for PQBP1 and cGAS. Signal intensity of PQBP1/cGAS for each viral particle is quantified and plotted according to the structural state of capsids, assessed by iGFP signal status (see Star method, bottom graphs). Scale bars: 5 μm (left column panels), 0.2 μm and 0.4 μm (middle and right column panels as indicated). Kruskal Wallis H; KW (p<0.001), followed by Dunn’s multiple comparisons *** p<0.001, ** p<0.01. Data represent the sum of 2 to 3 independent experiments. (C) PQBP1 is required for cGAS recruitment to viral particles. Top, THP-1 PMA-treated cells with either a non-targeting siRNA (NT) or siRNAs targeting PQBP1 (PQBP1–1 and -2), were infected with HIV-1 (Gag-IN-mRuby3) for 2.5 hours, followed by fixed imaging for cGAS. NC denotes the negative control where cells were only stained with secondary antibodies. Mean fluorescence intensity (MFI) of cGAS signal per viral particle (IN) is quantified. Median and error bars (-/+ 1.5*IQR) are shown. Box indicates the interquartile range (IQR). Dunn’s column comparison **** p<0.0001. Bottom, relative ratio of viral particles (INs) where co-associating cGAS MFI signals above the maximum value of NC sample are plotted from the data shown in top graph. All the HIV-1 infections of PMA-THP-1 cells were performed in the presence of VLP-Vpx coinfection. (D) Knockdown of PQBP1 results in decreased cGAMP production. PMA-THP-1, transfected with non-targeting siRNAs (NT) or siRNA targeting PQBP1, were challenged with HIV-1 for 2.5 hours and stained for cGAMP (green), cGAS (red), and DAPI (blue). Mean cGAMP signals per cell were graphed (bottom). Scale bar, 10 μm. Median and Error bars (-/+ 1.5*IQR) are shown. Box indicates the interquartile range (IQR). Mann-Whitney **** p<0.0001. Data are representative of three independent infections. All the data presented, unless otherwise stated, are representatives of at least two independent experiments. See also Figure S3.
