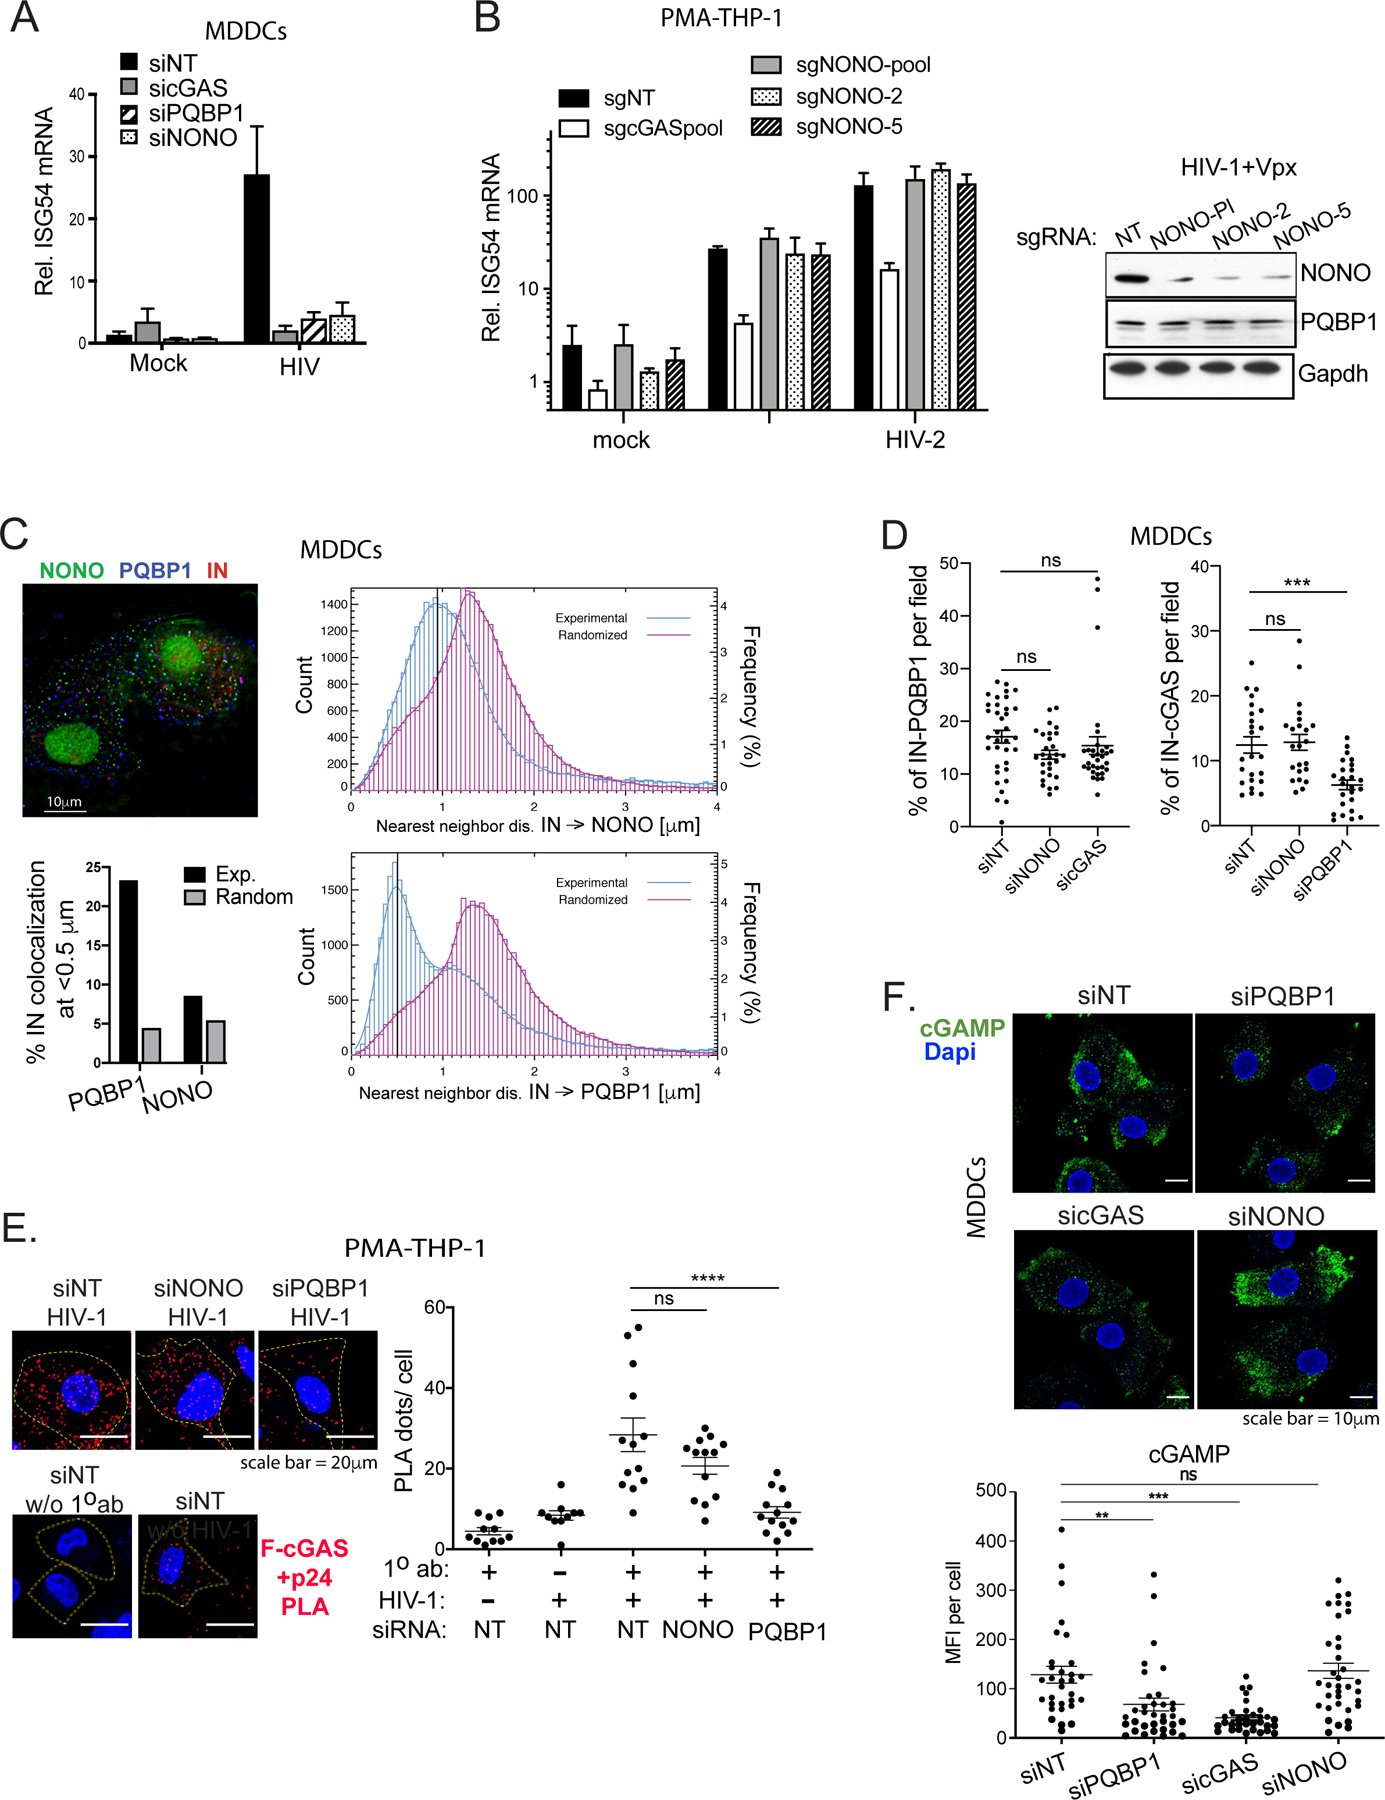
Figure 4. NONO is not required for the PQBP1-dependent cGAS sensing in the early stages of infection.

(A) NONO is required for HIV-1-induced ISG54 expression in MDDCs. Cells targeted by the indicated siRNAs were either mock-treated or infected with HIV-1 luciferase virus, followed by ISG54 mRNA quantification at 16 hrs post-infection. (B) NONO is not required for ISG54 induction during HIV-1 infection in PMA-differentiated THP-1 cells. Left, Cells were subjected to CRISPR gene editing with indicated sgRNAs (see Star method) and assessed for ISG54 mRNA inductions at 16 hours post-infection with either mock, HIV-1 in the presence of VLP-Vpx or HIV-2. Right, levels of NONO and PQBP1 proteins in cells targeted with indicated sgRNAs were shown accordingly. (C) Left, representative image of MDDCs infected with HIV-1 virus (IN-mRuby3) and stained for PQBP1 (blue) and NONO (green). Scale bar, 10 mm. Right, distribution of IN-NONO (top) or IN-PQBP1 (bottom) nearest neighbor distances (d). The distribution of experimental data (blue histograms) is compared with distribution generated from in silico randomized dots (magenta histograms). A kernel density estimate of each distribution is overplotted as a solid curve, represented as Frequency, N=27,932 INs. The percentage of INs that have either PQBP1 or NONO at d < 0.5 µm as well as the values for the randomized controls are graphed bottom left. (D) NONO depletion does not impair cGAS recruitment to incoming capsids. MDDCs treated with indicated siRNAs were infected with HIV-1 viruses (Gag-IN-mRuby3/GFP) for 2.5 hours, followed by immunostaining for cGAS and imaging. Fractions of total IN foci overlap with cGAS signal are graphed. Mean and SEM are shown. One-way ANOVA, *** p<0.001. The results are based on four independent experiments. (E) NONO is not required for cGAS recruitment to capsid in PMA-THP-1 cells. Efficiency of Flag-cGAS and viral p24 interactions in PMA-THP-1 cells targeted by indicated siRNAs was determined by a proximal ligation assay (PLA). The cells were infected with HIV-1 virus in the presence of VLP-Vpx for 2 hrs followed by paraformaldehyde fixation and PLA. Representative images (left) and quantification (right) of PLA dots (red) per cell are shown. Dapi (blue) and cell boundary (dotted line) are shown. Scale bar, 20 μm. Mean and SEM are shown. One-way ANOVA, **** p<0.0001. ns denotes no significance. (F) cGAMP production upon HIV-1 infection is not impaired by depletion of NONO. MDDCs, transfected with indicated siRNAs, were challenged with HIV-1 for 2.5 hours, then stained for cGAMP (green) and DAPI (blue). Scale bar, 10 μm. Mean cGAMP signals per cell were graphed (bottom). Mean and SEM are shown. One-way ANOVA, ** p<0.01, *** p<0.001, ns denotes no significance. All the data, unless noted otherwise, are representative of at least two independent experiments. See also Figure S4.
