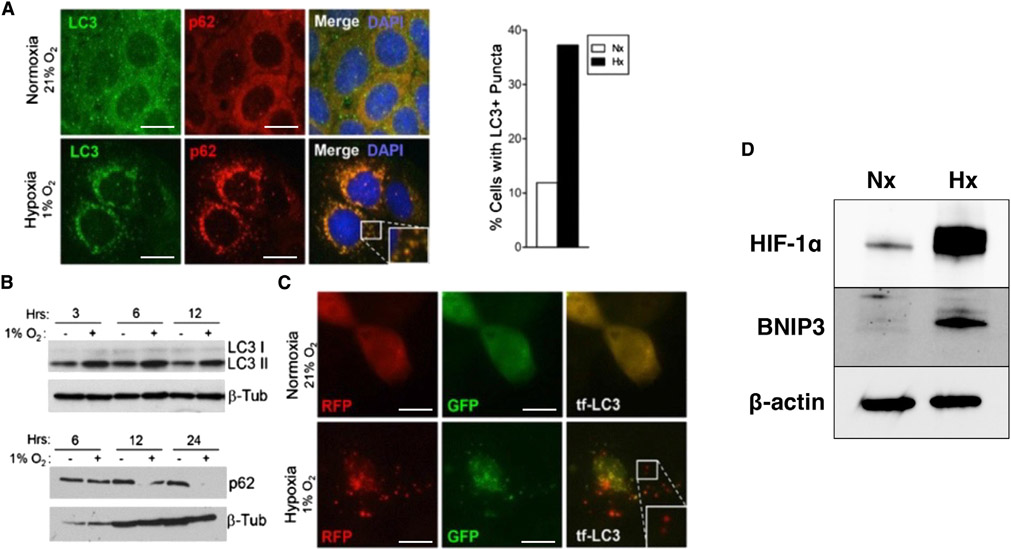
Figure 2. Hypoxia induces autophagy in IECs.
(A) Incubation of Caco-2 IECs in either normoxia or hypoxia (1%O2, 24 h), followed by immunofluorescence staining, reveals increased LC3 and SQSTM1/p62 puncta in hypoxia-treated cells.
(B) Measurement of LC3 and p62 by western blot in Caco-2 IECs during time course incubation at normoxia or hypoxia.
(C) Caco-2 IECs transfected with tf-LC3 followed by incubation at normoxia or hypoxia. The increase in red puncta (bottom panels) demonstrates increased autophagic flux in hypoxia-treated cells.
(D) Caco-2 IECs incubated at hypoxia (Hx) show increased expression of HIF-1α and BNIP3 compared with normoxic (Nx) controls. Results are representative of at least two separate experiments. Microscopy images at 1,000×; scale bar: 10 μm.

