Figure 2.
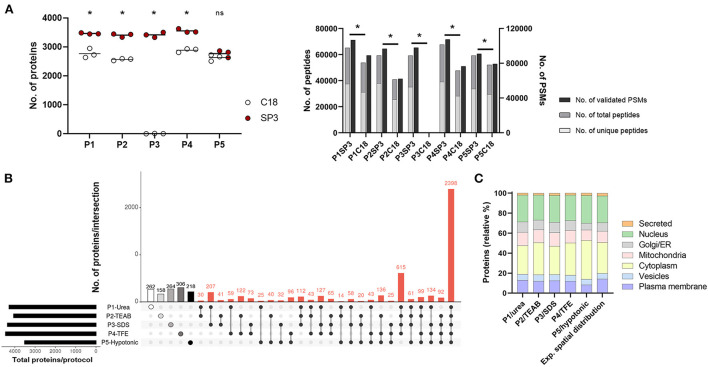
Performance of P1-P5 cell lysis protocols combined with SP3 or C18 clean-up methods in 50,000 dTHP1 cells. Experiments were run in triplicate and depicted proteins were identified with at least 2 unique peptides. (A) Number of proteins (left panel), peptides (total and unique) and validated peptide spectrum matches (PSMs) (right panel) identified per procedure. (B) Attribute plot displaying the qualitative proteomic analysis of P1–P5 combined with SP3. Here, maximum proteome coverage (i.e., all proteins identified by any of the three replicates per protocol) was considered in the analysis. Each vertical bar shows unique protein numbers and corresponds to either a unique procedure (white-, light grey-, medium grey-, dark grey- and black-filled dots for P1-, P2-, P3-, P4-, and P5-SP3 combinations, respectively) or a set of procedures (black dots interconnected by lines). The bar chart on the bottom left side plots the total number of proteins identified per protocol. (C) Subcellular location distribution of proteins identified per protocol and expected spatial distribution for dTHP1 proteome (based on all protein datasets for this cell model). Protein numbers are expressed in relative percentages (%). The main subcellular location per protein was assigned according to UniProt database. Data used for the graph is collected in Supplementary Table 5. P1, urea-; P2, TEAB-; P3, SDS-; P4, TFE-; and P5, hypotonic-based cell lysis. *p-value <0.05 and 10% FDR; ns, not significant. Significant differences were calculated using the Mann Whitney test.

