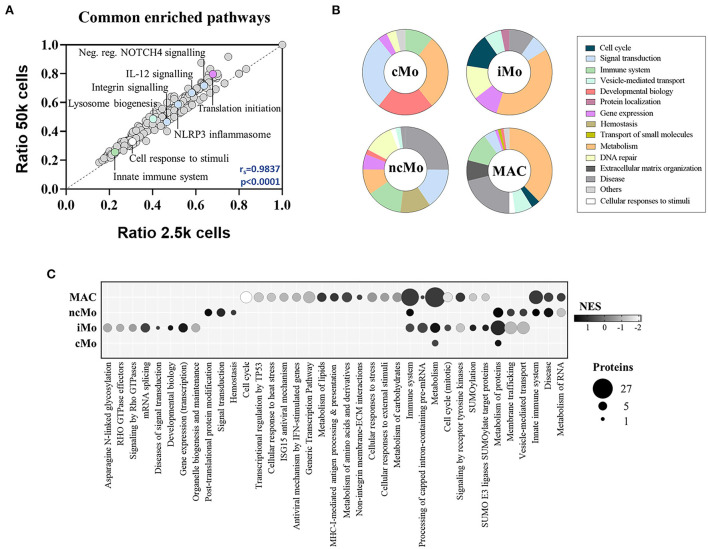
Figure 5.
Functional enrichment analysis of the three major monocytic populations from peripheral blood of healthy donors and macrophages/microglia from glioblastoma patients. (A) Scatter plot showing the correlation between significantly enriched (p-value < 0.05) functional pathways in 50 and 2.5k cells from all studied populations, based on found entities/total defined ratios calculated from proteins in common for all populations. Spearman correlation coefficient (rs) and p-value (p) are indicated. (B) Main groups of functional pathways defined by unique proteins per population. (C) Selection of functional pathways determined by distinctive proteins per population. Bubble size is proportional to number of proteins, and bubble color indicates the normalized enrichment score (NES) calculated based on the protein expression data. cMo, classical monocytes; iMo, intermediate monocytes; ncMo, non-classical monocytes; MAC, macrophage/microglia.

