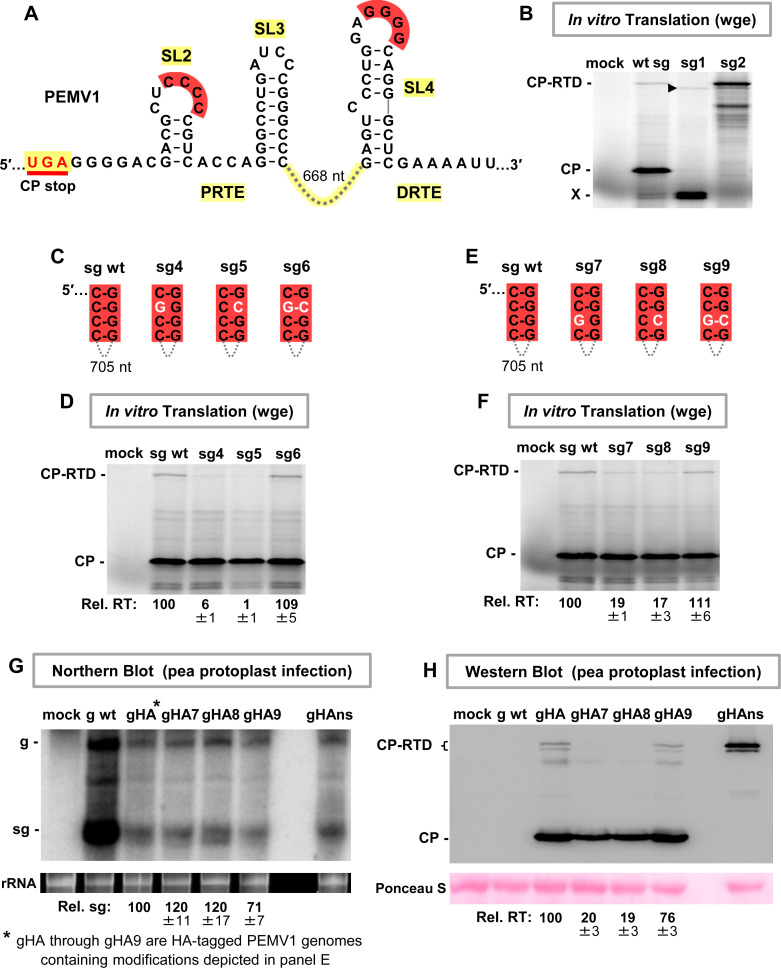
Fig 3. Assessing the red long-distance RNA-RNA interaction.
(A) Secondary structures for the PRTE alternative fold and DRTE in PEMV1. The intervening 668 nucleotides between SL3 and SL4 are depicted by a connecting dashed line. (B) Wheat germ extract (wge) in vitro translation assay testing wt and mutant PEMV1 sg mRNAs. In mutants sg1 and sg2, the CP start codon and the CP stop codon, respectively, were inactivated (AUG → CAG and UGA → GGA). The sg mRNAs tested are indicted above each lane and the identities of the translated viral proteins are indicated on the left. The X-designated doublet band likely represents translation initiation at internal start codons in the CP ORF, and their probable readthrough products are indicated by the arrowhead. (C) and (E) Compensatory mutations introduced in the sg mRNA to test the red interaction. Nucleotide substitutions are shown in white. (D) and (F) In vitro translation analyses of the sg mRNAs shown in panels C and E, respectively. Average relative readthrough (Rel. RT) levels (±SE) calculated from three independent trials are shown below each lane. (G) Northern blot analysis of total nucleic acids isolated from pea protoplasts transfected with wt and HA-tagged mutant PEMV1 genomes. gHA, gHA7, gHA8, gHA9 and gHAns each contain a triple HA tag inserted 6 amino acids from the CP N-terminus. Tagged genomic mutants gHA7, gHA8 and gHA9 contain the same compensatory mutations as shown in panel E, and genomic mutant gHAns has the same CP stop codon knockout substitution as mutant sg2 in panel B. Substitutions in the DRTE in gHA8 and gHA9 lead to an arginine to serine amino acid change in CP-RTD. Positions of the genome (g) and sg mRNA (sg) are shown on the left side of the blot. Average sg levels (±SE) were calculated from three independent trials and are displayed below each lane. An ethidium bromide-stained rRNA loading control is shown below the Northern blot. (G) Western blot analysis of total proteins extracted from the same pea protoplast infections as in panel G. Identities of the detected viral proteins are indicated on the left and averaged Rel. RT levels (±SE) from three independent trials are shown under each lane. Ponceau S-stained loading control of the blot is shown below.

