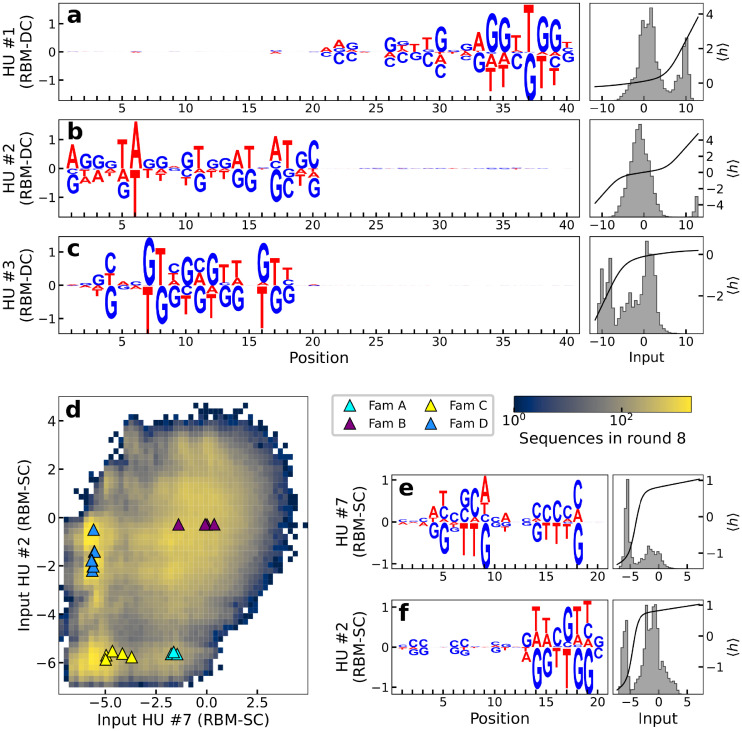
Fig 4. Weights learned by the RBMs have biological interpretations.
a-c: Left: logos of three weights μ = 1, 2, 3 with largest Frobenius norms for RBM-DC trained on round 8 aptamer data; Right: histograms of the inputs Iμ = ∑i wμi(si) (where wμi is the weight of the connection between hidden unit μ and visible unit i for nucleotide si) to the corresponding hidden units for the sequences s in the dataset (gray) and average activity (black). d: The four families identified in [41] are separated in different clusters in the two-dimensional subspace spanned by the inputs to hidden units 2 and 7 of RBM-SC (trained on loop subsequences at round 8). e, f: Logo, distribution of inputs and average activity of the same hidden units as in panel D.

