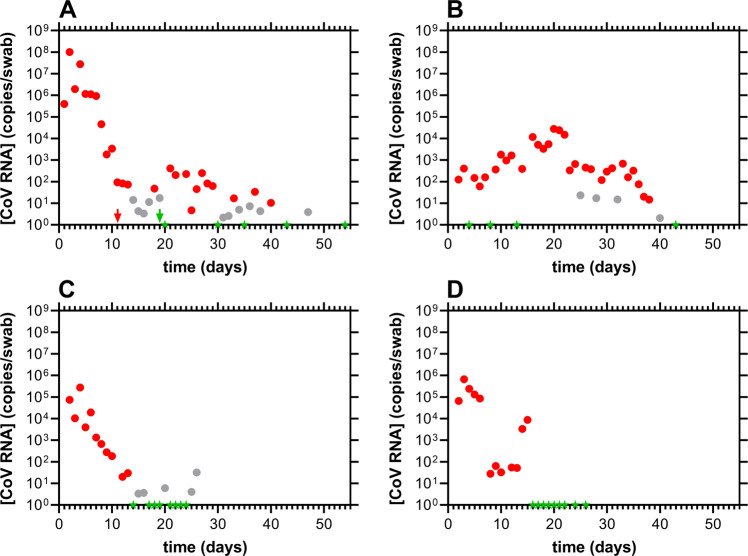
Fig. 2. Longitudinal viral load kinetics for subject 21 across multiple anatomic compartments.
Red, positive; gray, inconclusive (i.e., only one of the two oligonucleotide probes targeting the viral nucleocapsid protein gene transcript fragment met the assay threshold for positivity); green, negative (i.e., both viral probes led to Ct values above 40, but the human gene transcript control had a Ct value below 40. These consist of valid samples where the SARS-CoV-2 content was below the limit of quantitation of the assay); arrows designate clinical RT-qPCR test results (i.e., from separate, CLIA laboratory, outside of current clinical study); the axis ranges are the same across all four panels for ease of comparison. A nasal swab viral RNA copy dynamics; B stool swab viral RNA copy dynamics; C oral swab viral RNA copy dynamics; D viral RNA copy dynamics in saliva samples processed with the Super SAL2 kit (Oasis Diagnostics, Vancouver, WA). The qPCR assay, and the associated interpretation of test results, have been discussed in detail elsewhere18.

