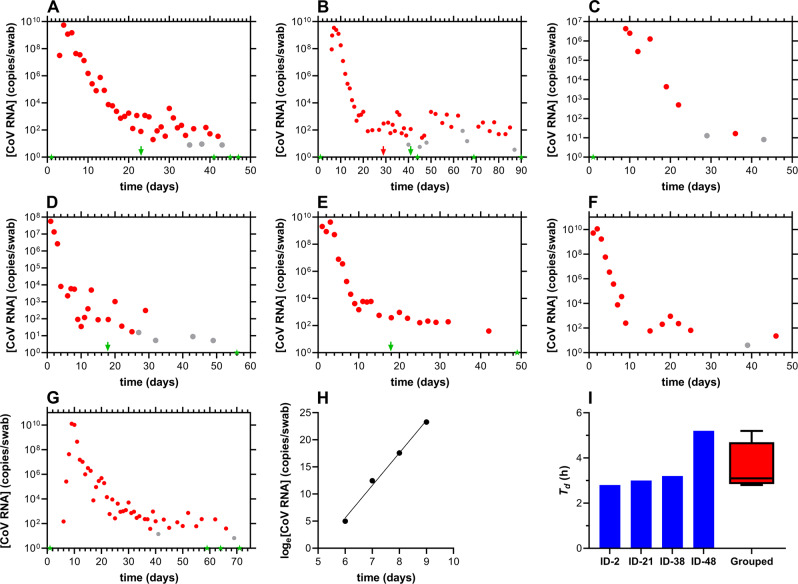
Fig. 3. Longitudinal nasal swab SARS-CoV-2 viral load kinetics.
Red, positive; gray, inconclusive; green, negative; arrows designate clinical qPCR test results (i.e., from separate, CLIA laboratory, outside of current clinical study). A subject 38; B subject 48; C subject 63; D subject 83; E subject 84; F subject 85; G subject 2, where the complete growth curve life-cycle is captured, including short lag phase between a negative test result (green star) and the first positive test result (red circle), a rapid exponential growth phase, and a slow decline phase. H Plot of exponential growth phase for subject 2 used to estimate a SARS-CoV-2 in vivo doubling time of 2.8 h (R2 = 0.9934). I In vivo SARS-CoV-2 doubling times during the exponential growth phase for four subjects; subject 2, 2.8 h; subject 21, 3.0 h; subject 38, 3.2 h; subject 48, 5.2 h; grouped, box plot of doubling times, Td, for all four study participants. The box extends from the 25th to 75th percentiles, with the horizontal line in the box representing the median (3.1 h); whiskers represent the lowest and highest datum.

