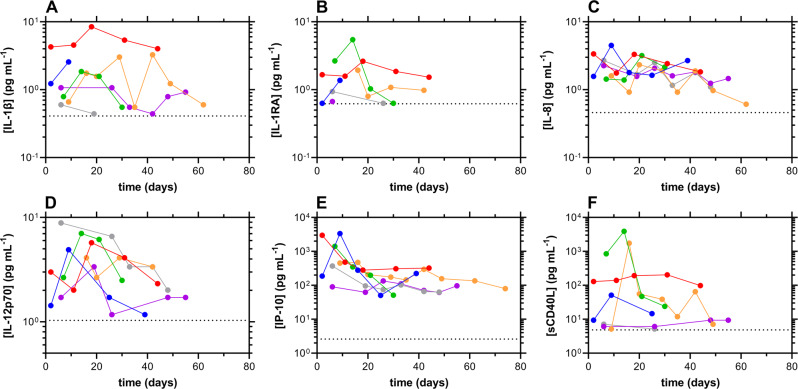
Fig. 5. Cytokine/chemokine concentration-time profiles for participants testing positive nasally for SARS-CoV-2 RNA, normalized temporally to the first day of positivity by RT-qPCR.
Not all subjects testing positive participated in the blood collection portion of the study. The dotted line represents the assay lower limit of quantitation; blue, subject 2; red, subject 21; green, subject 38; orange, subject 48; magenta, subject 83; gray, subject 84. A IL-1β; B IL-1RA; C IL-8; D IL-12 p70; E IP-10; F sCD40L.

