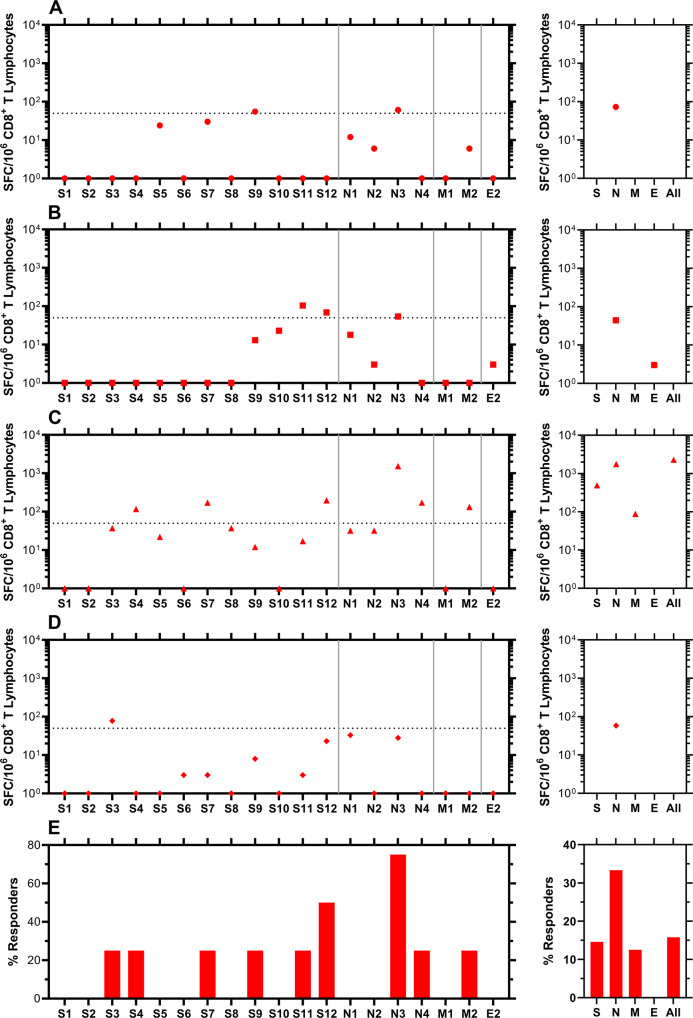
Fig. 8. Evaluation of CD8+ T-cell targeting of SARS-CoV-2 in blood samples from participants who became positive for SARS-CoV-2 RNA by RT-qPCR 2–4 months earlier.
IFN-γ ELISpot was performed on polyclonally expanded CD8+ T cells using peptides spanning spike, nucleocapsid, matrix, and envelope proteins that were combined in pools of 16 or fewer. Spike was contained in 12 pools (S1 to S12), nucleocapsid in four pools (N1 to N4), matrix in two pools (M1 to M2), and envelope in one pool (E2). Panels A–D present frequencies of responses from individual participants, while panel E provides summary data as percentages of persons responding against each pool. Each panel consists of two sub-panels, with the left sub-panel showing responses against individual peptides, while the right sub-panel shows the total responses for each peptide pool. Negative values for the responses were replaced by zeros in the left sub-panels. The total values for S, N, and M do not necessarily equal the sums of the pools because the sums were calculated including negative values after background subtraction. Horizontal dotted lines indicate the cutoff for positivity based on the following criteria: at least 50 SFC/106 CD8+ T Lymphocytes and > mean and two standard deviations of negative control wells (no peptide). A Circles, subject 2; B squares, subject 21; C triangles, subject 38; D diamonds, subject 48.

