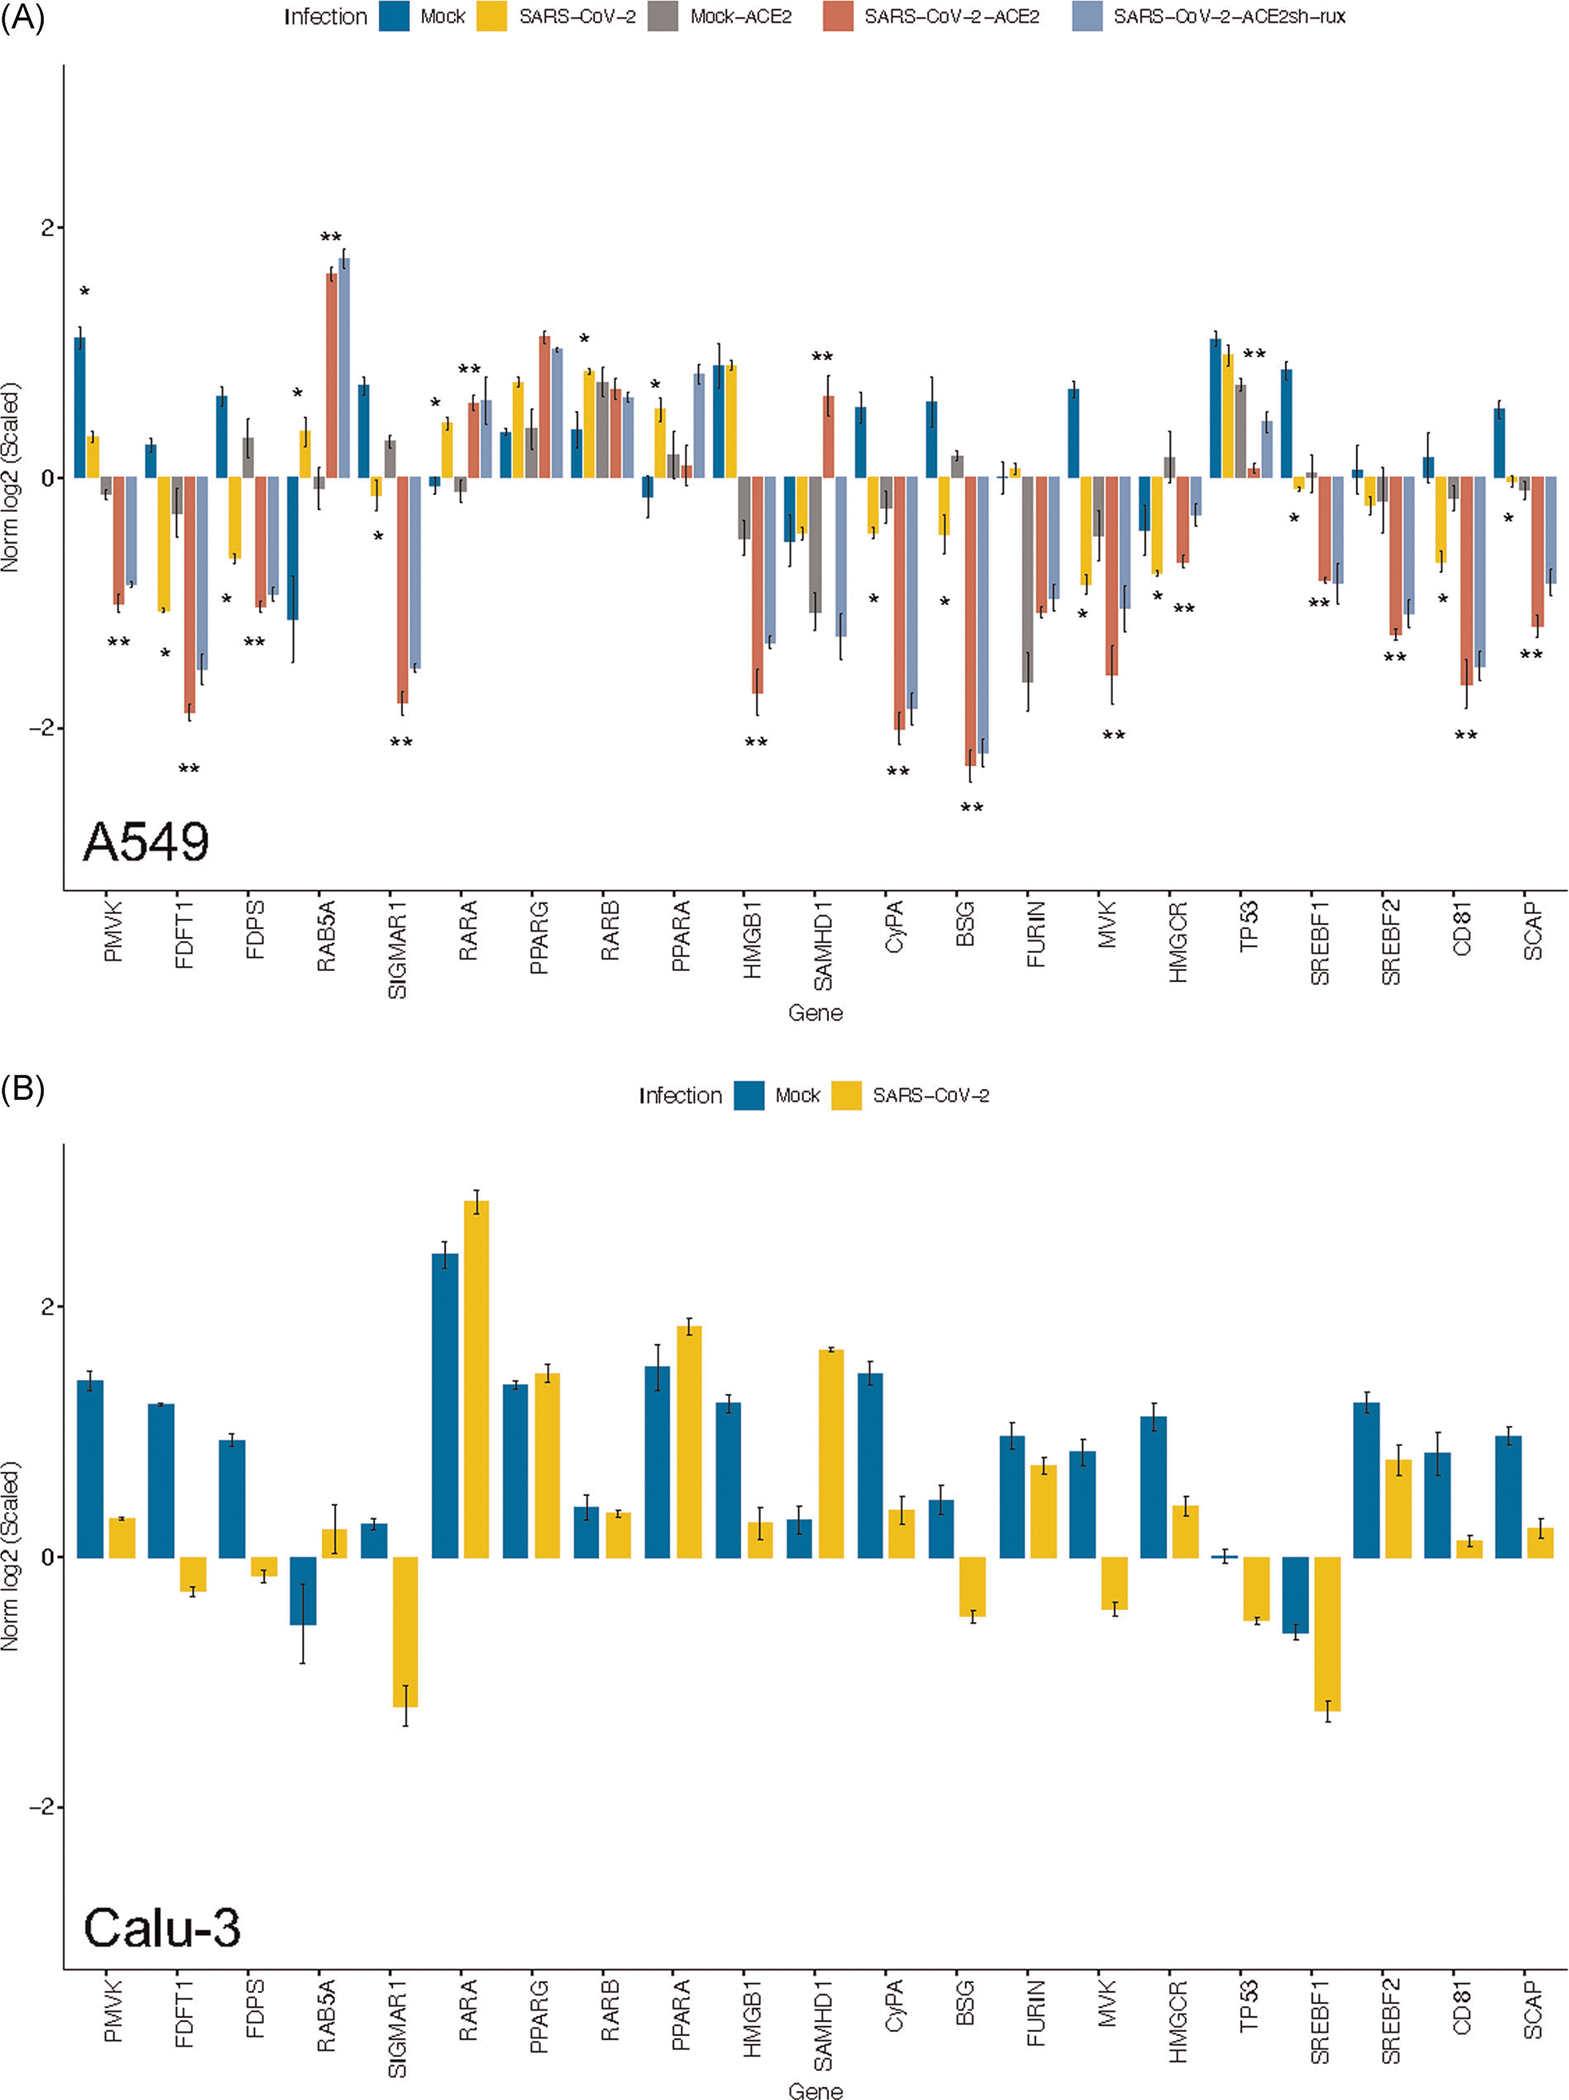
FIGURE 1.

Dysregulation of candidate genes as a consequence of SARS-CoV-2 infection. Gene expression data were obtained from Blanco-Melo et al. (GSE147507). Candidate genes involved in the pathogenesis of COVID-19 were represented as scaled values. Gene expression was analyzed from (A) A549 and (B) Calu-3 cells. *p < .05 for Mock versus SARS-CoV-2; **p < .05 for Mock-ACE2 versus SARS-CoV-2-ACE2
