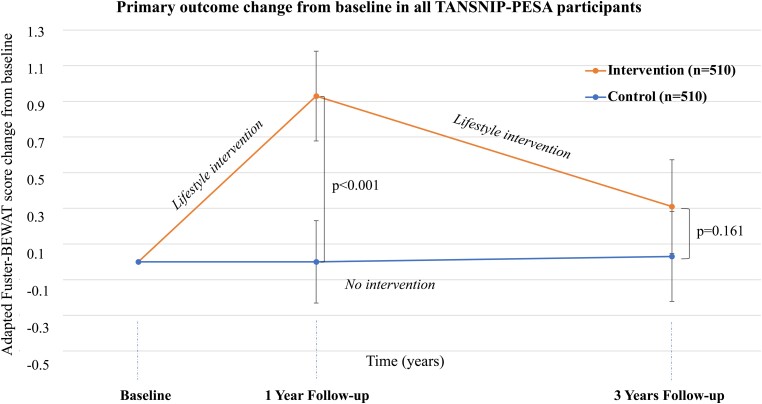
Figure 3.
Change in the primary outcome at baseline, 1-year follow-up, and 3-year follow-up in all TANSNIP-PESA participants. The line-plot represents mean change (dots) for the adapted Fuster-BEWAT score at different follow-up times relative to values at the initial screening for intervened participants (orange) and controls (blue). P-values as derived from between-group differences of Fuster-BEWAT score change at each follow-up assessment from baseline using linear mixed effect regression models. The score ranges from 0 (poor cardiovascular health) to 24 (ideal cardiovascular health) and is derived from the sum of the individual components (0–4 points each). Adapted Fuster-BEWAT score, Blood pressure, Exercise (PA and sedentary time), Weight (BMI), Alimentation (fruit and vegetable consumption), and Tobacco (smoking habit); PESA, Progression of Early Subclinical Atherosclerosis; TANSNIP, Trans-Atlantic Network to study Stepwise Non-invasive Imaging as a tool for CVD Prognosis and prevention.

