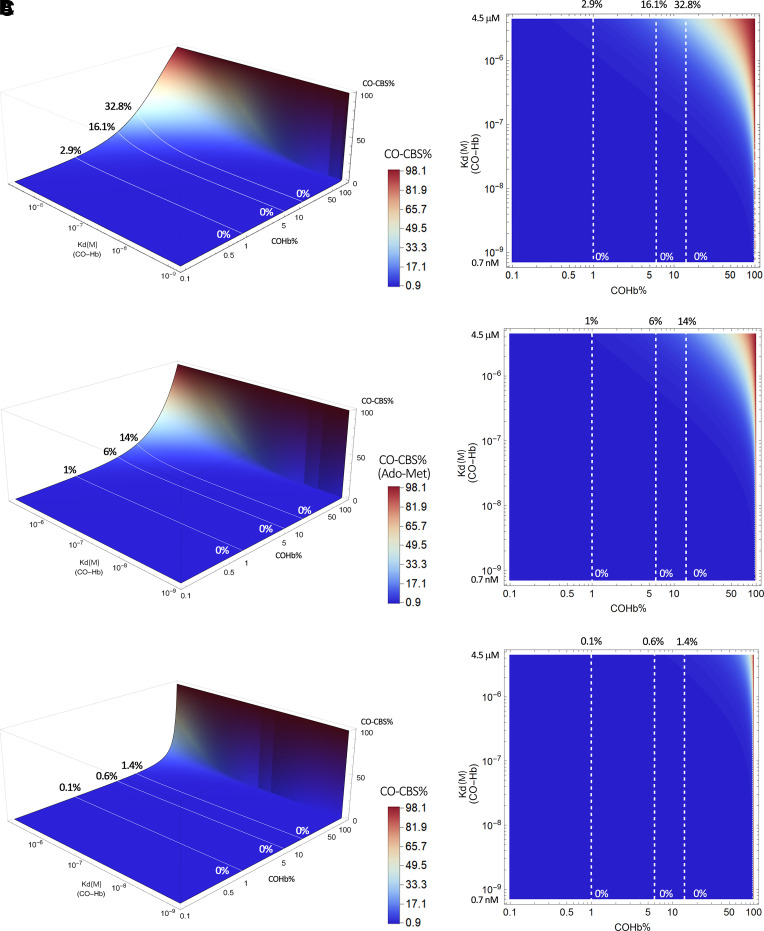
Fig. 17.
Estimated CBS saturation levels as a function of the conformational state of COHb and COHb levels. (Upper panel, Kd = 1.5 μM; middle panel, Kd = 4.5 μM, with AdoMet; bottom panel, Kd = 45 μM, AdoMet-free CBS. Solid lines in the left panel and dashed lines in the right panel represent scenarios in the presence of 1%, 6%, and 14% COHb, respectively.) The graphs were generated based on eq. 1 by using Mathematica 12 (codes provided in Supplemental Appendix 2).

