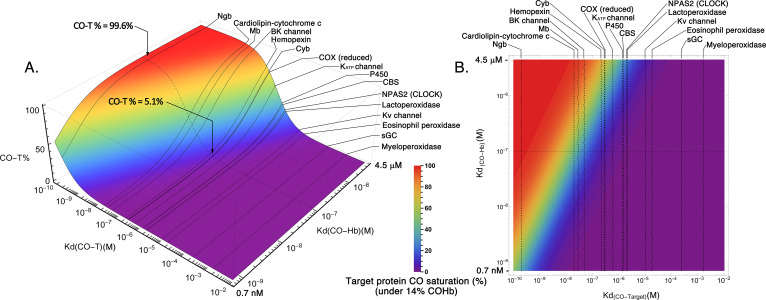
Fig. 4.
Overall contour map of CO’s binding with various targets under 14% COHb level as the reference point. (A) A 3-D plot of the target CO saturation percentage (CO-T%, z-axis) of various hemoproteins with definitive Kd(CO-T) (x-axis) at a given Kd(CO-Hb) (y-axis); (B) A 2-D contour map of the 3-D plot A. Target protein CO saturation percentage is shown by different colors. In (A) and (B_, the dashed lines in the graphs mark the point of Kd = 0.1 μM CO-hemoglobin binding. It serves as a reference level showing that for a high-affinity target (Ngb), 14% COHb leads to saturation by CO to a level of 99.6%, whereas for a target of moderate CO affinity (COX), 14% COHb only leads to 5.1% CO saturation. The graphs were generated based on eq. 1 by using Mathematica 12 (codes provided in Supplemental Appendix 2).

