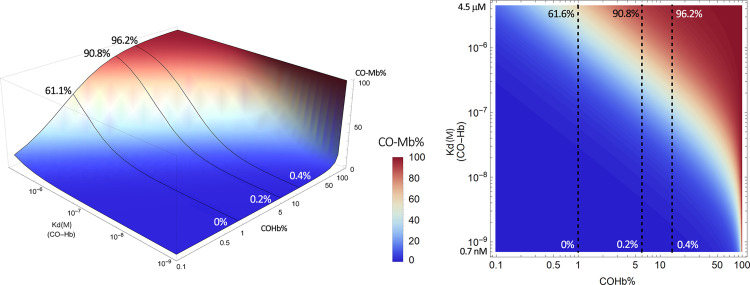
Fig. 7.
Estimated CO saturation levels of myoglobin in the presence of COHb at various concentrations. Solid lines in the left panel and dashed lines in the right panel represent scenarios with COHb concentrations at 1%, 6%, and 14%, respectively. The graphs were generated based on eq. 1 by using Mathematica 12 (codes provided in Supplemental Appendix 2).

