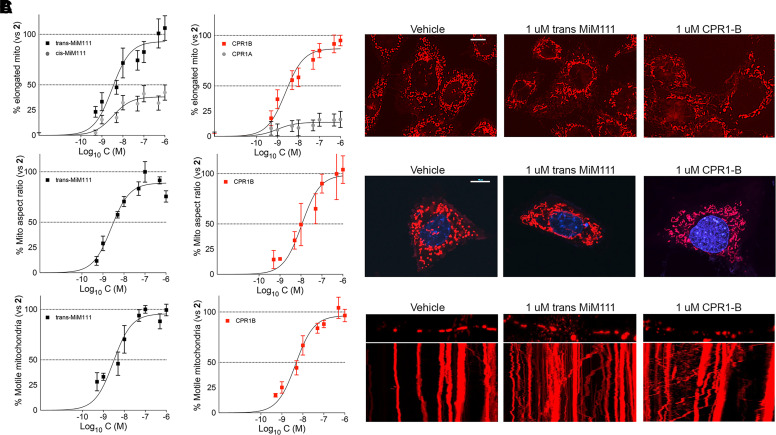
Fig. 2.
Mitofusin activator concentration-response relationships for mitochondrial fusion and motility. (A) Fusogenicity measured as the proportion of Mfn2 null MEFs having a preponderance of elongated filamentous mitochondria. Comparisons to each compound’s less active stereoisomer are shown. (B) Fusogenicity measured as mitochondrial aspect ratio (organelle length/width) in Mfn2 null MEFs. (C) Mitochondrial motility measured as % motile mitochondria in neuronal processes of MFN2 T105M expressing murine DRGs. Means ± S.E.M. of 3 experiments with 8 (A), ∼15 (B), or 4–5 (C) replicates. Representative images are shown to the right; mitochondria are stained red. Scale bars are 10 um. In Figs. 2 and 4 trans-MiM111 is black and CPR1-B is red.

