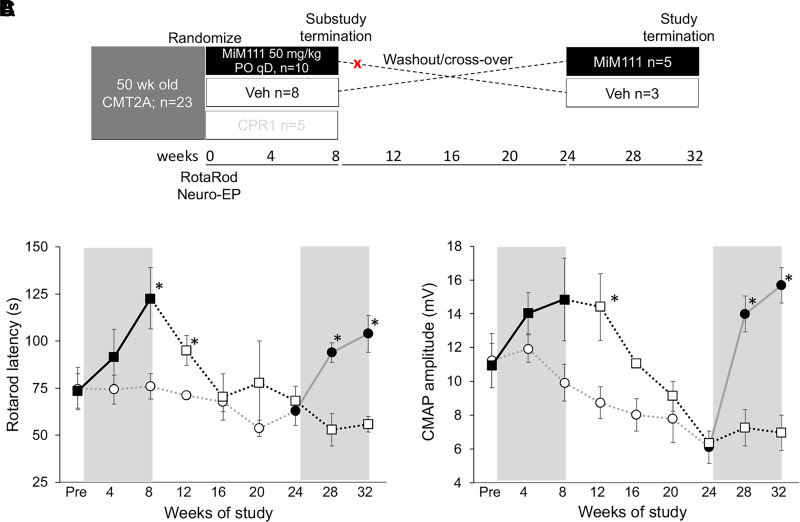
Fig. 6.
CMT2A recurs after mitofusin activation is withdrawn in MFN2 T105M mice. (A) Schematic depiction of experimental design for this substudy, which was a continuation of the experiment depicted in Fig. 4. Red X indicates where one mouse was withdrawn due to an unrelated medical issue. (B and C) Rotarod latency (B) and CMAP amplitude (C) results. Bold lines indicate MiM111 treatment group within gray background treatment periods. * = P < 0.05 versus corresponding vehicle group (t test).

