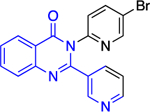
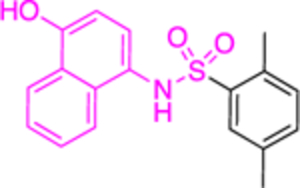
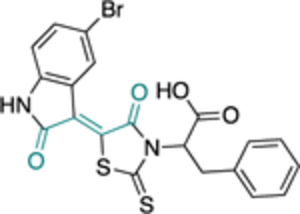
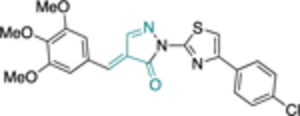
Table 2.
Comparison of IC50 values for PfGluPho and hG6PD; shift of focus from antimalarial to anticancer agents by the Bode group; Numbers in parenthesis as taken from the original paper. For 14a 1: (w/ pre-incubation and post-dilution), 2: (only pre-incubation).
| Compound | Structure | PfGluPho IC50 (μΜ) | IC50 Comparison | hG6PD IC50 (μΜ) |
|---|---|---|---|---|
| 12a (CB104) |

|
7.6 ± 4.0 | > | 3.0 ± 1.2 |
| 12b (CB70) |

|
4.5 ± 1.6 | > | 2.6 ± 0.1 |
| 14a (CB83) |

|
22.0 ± 0.8 | > | 0.2 ± 0.01 or 0.4 ± 0.02 |
| 30 (CB72) |

|
- | 3.1 ± 0.8 | |
| 31 (CB63) |

|
1.7 ± 0.2 | > | 0.6 ± 0.0 |
