
Figure 6.
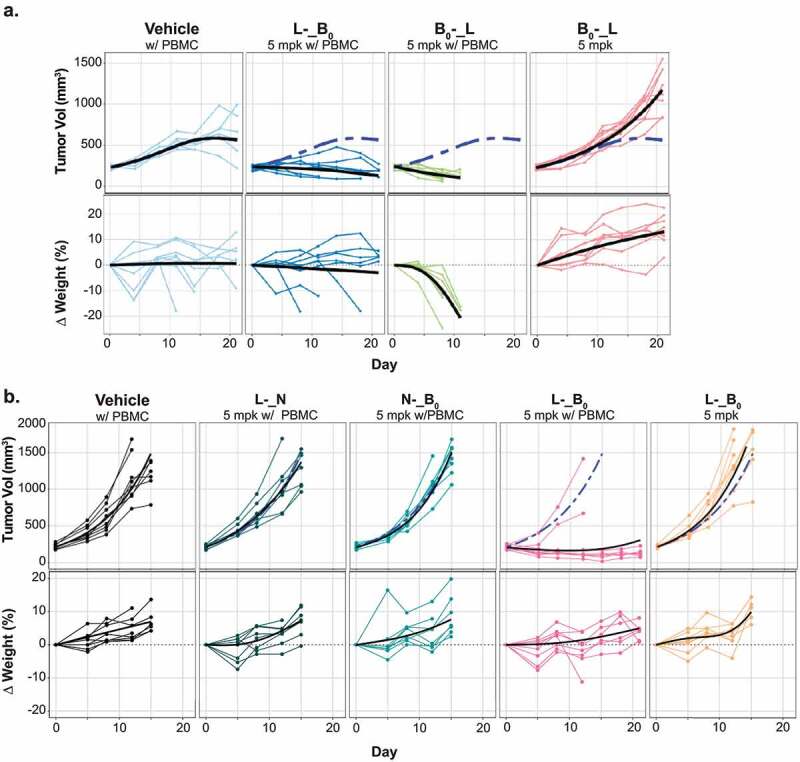
In vivo activities of trispecific antibodies. A-B. The HCC1569x2 model was implanted into NSG mice engrafted with human PBMCs. Once tumors reached ~200 mm3, tumor growth (top) and body weight (bottom.) were assessed following a single administration of the indicated treatments. Graph legends: thin lines: responses of individual mice; thick black lines: group average; dashed blue line: average response of mice treated with PBMCs alone.
Figure 6A. LME-fitted tumor growth curve of HCC1569x2 tumors and body weights of mice treated with indicated antibodies. L-_B0 shows tumor control without substantial body weight loss while B0_L shows substantial body weight regression.Figure 6B. LME-fitted tumor growth curve of HCC1569x2 tumors and body weights of mice treated with indicated antibodies. L-_B0 shows tumor control without substantial body weight loss while trispecific antibodies binding only a single tumor antigen are ineffective.