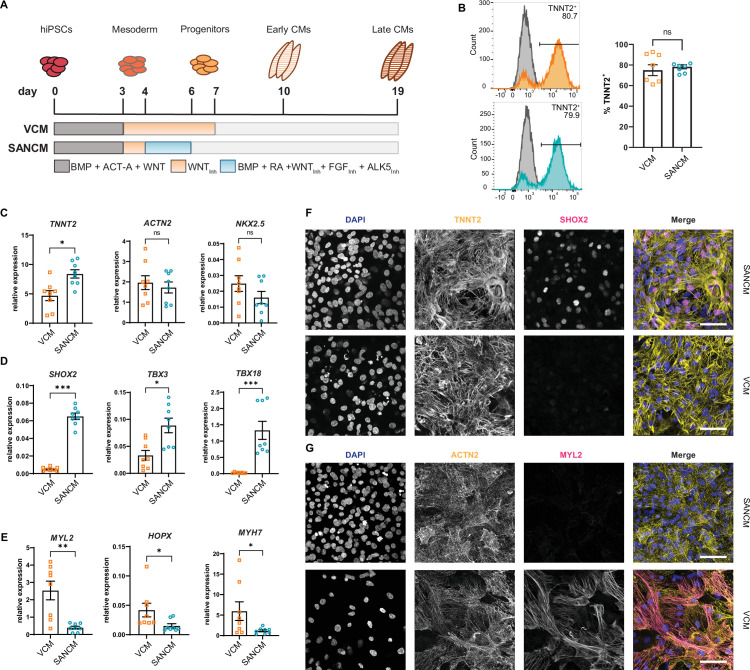
Figure 1. Differentiation of human induced pluripotent stem cells (hiPSCs) to sinoatrial node (SANCM) and ventricular-like cardiomyocytes (VCM).
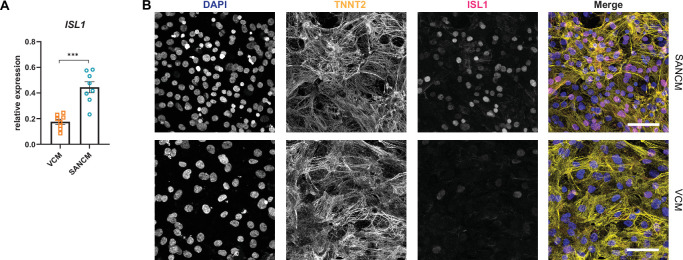
(A) Schematic representation of protocols used to differentiate hiPSCs to VCM and SANCM. (B) Representative histograms (left) and summarized data (right) showing percentage of TNNT2+ cells in VCM (orange) and SANCM (blue) at day 19 of differentiation. A corresponding IgG isotype antibody was used as negative control for flow cytometry (gray). N=7 independent differentiations. Error bars, s.e.m. Mann-Whitney U test: p>0.05 (ns). (C–E) RT-qPCR depicting expression of pan cardiomyocyte genes (C), SAN-associated genes (D), and ventricular-associated genes (E) at day 19 of differentiation. N=8 independent differentiations; corrected to GEOMEAN of reference genes RPLP0 and GUSB. Error bars, s.e.m. Mann-Whitney U test: p<0.05 (*), p<0.005 (**), p<0.0005 (***). (F–G) Immunofluorescence stainings demonstrating the expression of nuclear stain DAPI, SHOX2, and TNNT2 (F), MYL2 and ACTN2 (G), in SANCM and VCM. Scale bars, 50 μm. Also see Figure 1—figure supplement 1.


