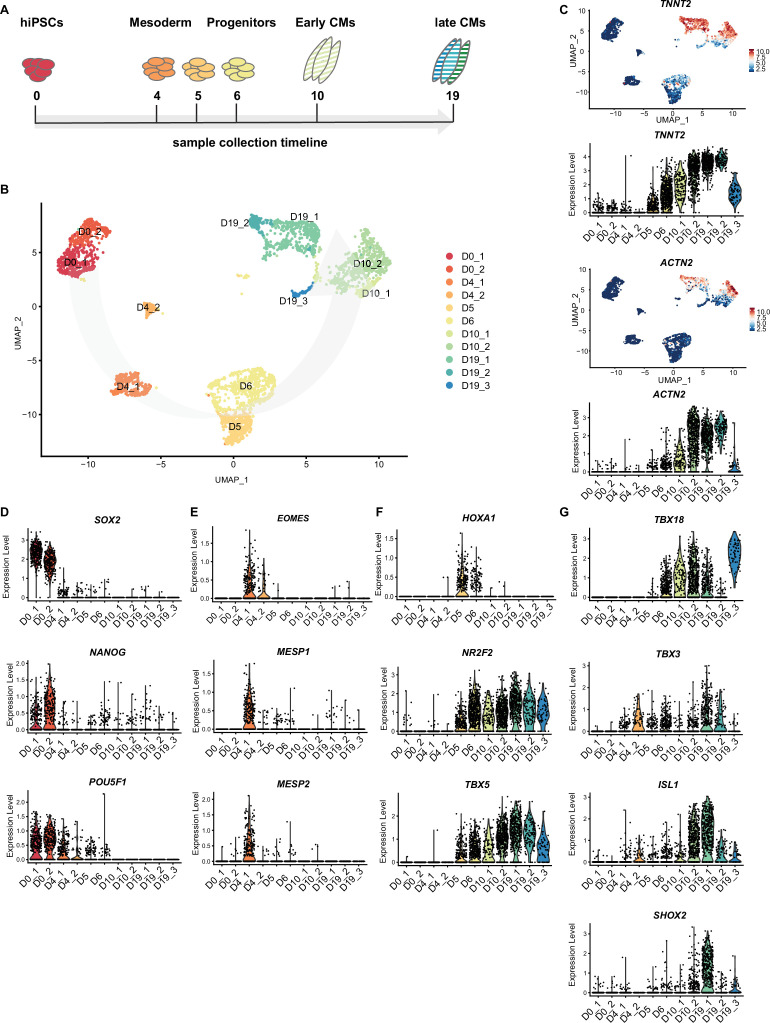
Figure 4. Time course single cell RNA-sequencing of SANCM.
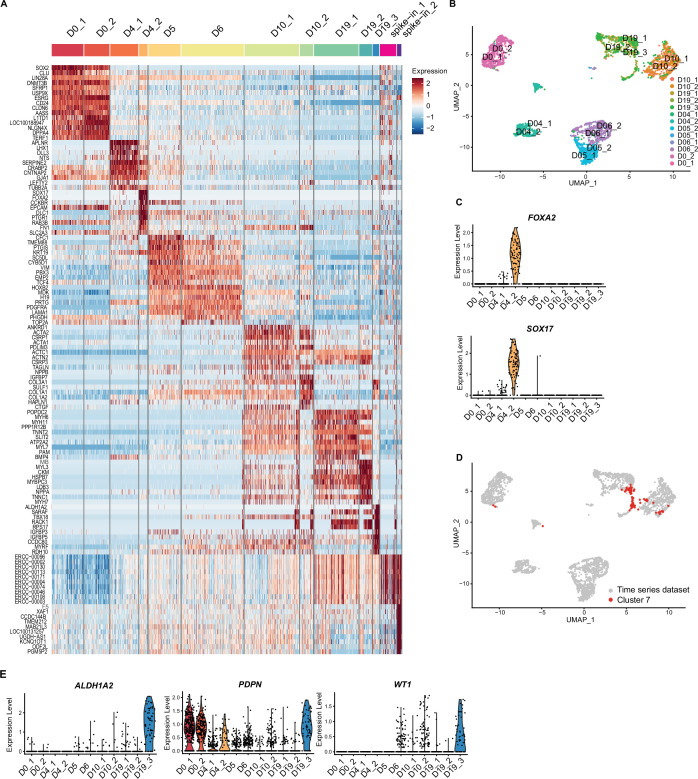
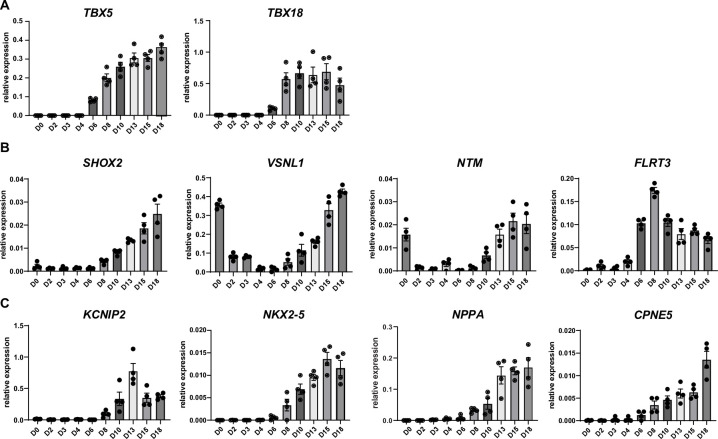
(A) Timeline of hiPSC differentiation to SANCM representing sample collection time points. (B) UMAP representation of single cell transcriptomes collected at different time points throughout differentiation from hiPSC to SANCM. Arrow indicates course of differentiation. (C) UMAP feature plots and violin plots showing TNNT2 and ACTN2 gene expression at different stages of SANCM differentiation. (D–H) Violin plots of pluripotency genes (D), mesodermal genes (E), posterior cardiac progenitor genes (F), proepicardial genes (G), and SAN-associated transcription factor genes (H). hiPSCs, human induced pluripotent stem cells; CPC, cardiac progenitor cells; CMs, cardiomyocytes; UMAP, uniform manifold approximation and projection; SANCM, sinoatrial node-like cardiomyocyte. Also see Figure 4—figure supplement 1 and Figure 4—figure supplement 2.


