Figure 1.
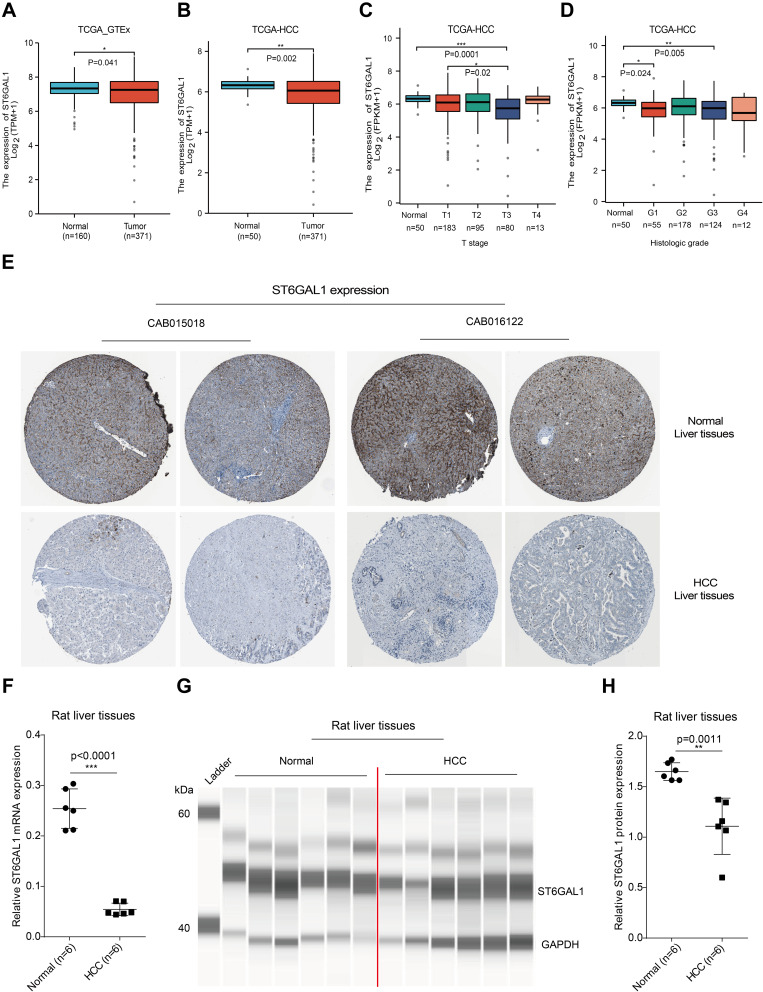
ST6GAL1 expression in normal and HCC liver tissues. (A) The ST6GAL1 mRNA expression of HCC (n = 371) and normal tissues (n = 160) in the TCGA and GTEx databases; (B) The ST6GAL1 mRNA expression of HCC (n = 371) and adjacent non-tumor tissues (n = 50) in the TCGA database; (C and D) The ST6GAL1 mRNA expression of different T stages (C) or histologic grades (D) in the TCGA database; (E) The ST6GAL1 protein expression in the HPA database; (F) The ST6GAL1 mRNA expression levels in liver tissues of normal (n = 6) and HCC (n = 6) rats, detected by qRT-PCR and GAPDH as the internal reference; (G) The ST6GAL1 protein expression levels in liver tissues of normal (n = 6) and HCC (n = 6) rats, detected by capillary electrophoresis analysis and GAPDH as the internal reference; (H) The integrated density analysis of the protein bands. *p < 0.05, **p < 0.01, ***p < 0.001.

