
Figure 2.
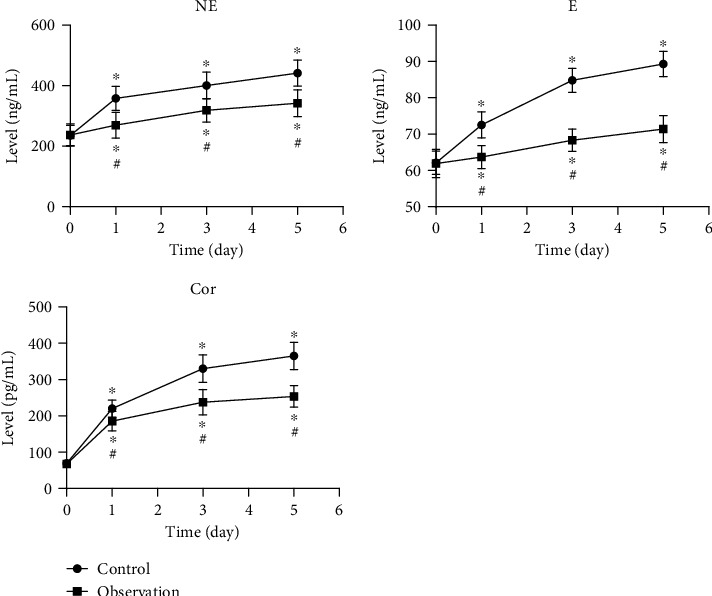
Stress response before and after surgery in 2 groups. ∗P < 0.05, compared to preoperative levels; #P < 0.05, compared to the control group.
Official websites use .gov
A
.gov website belongs to an official
government organization in the United States.
Secure .gov websites use HTTPS
A lock (
) or https:// means you've safely
connected to the .gov website. Share sensitive
information only on official, secure websites.
Stress response before and after surgery in 2 groups. ∗P < 0.05, compared to preoperative levels; #P < 0.05, compared to the control group.