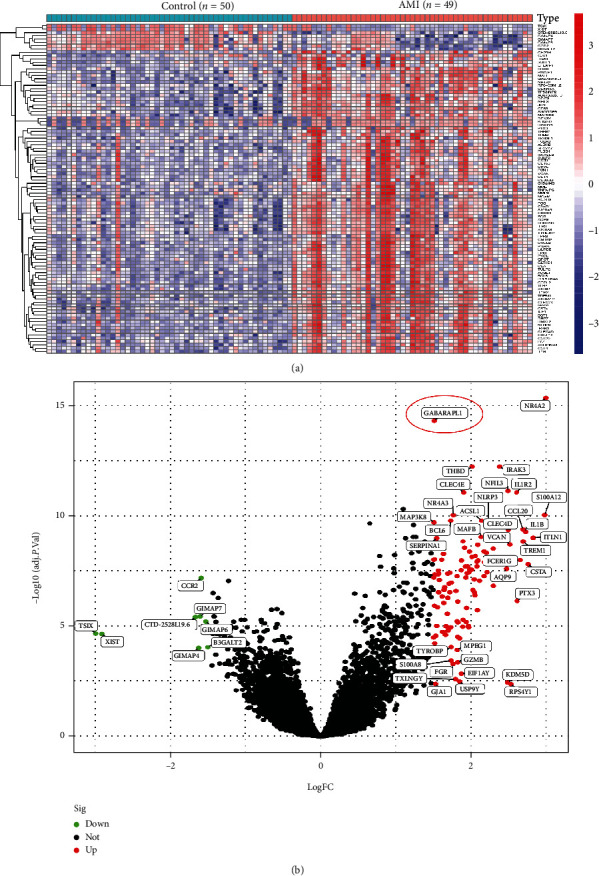
Figure 1.

DEGs between AMI and control samples. (a) Heatmaps of DEGs between AMI and control samples. (b) Volcanic map showing DEGs between AMI and control samples. Red dots exhibit significantly increased gene expression. Green dots exhibit significantly reduced gene expression. Block dots show non-DEGs.
