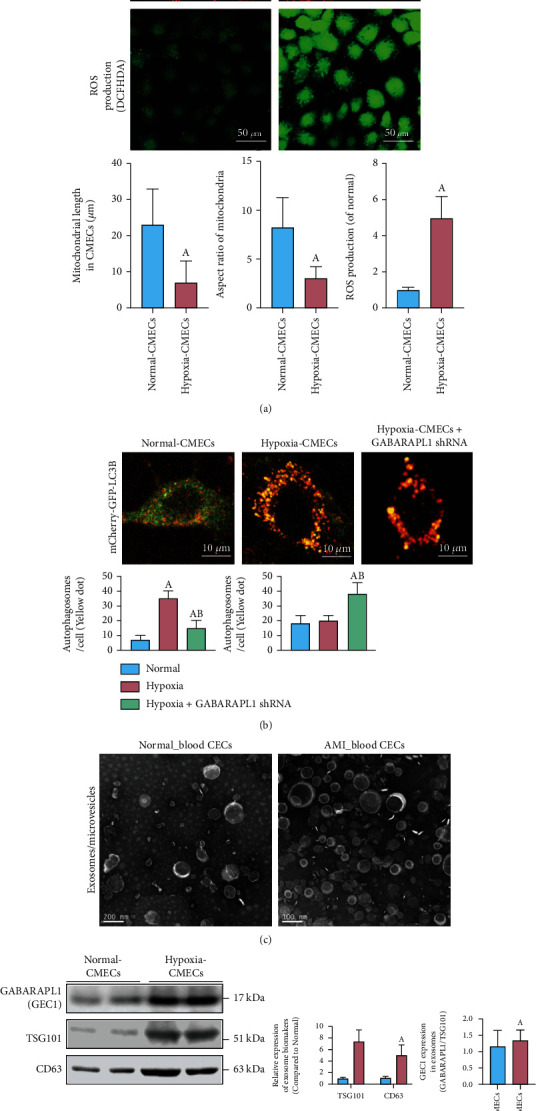
Figure 5.

The detection of mitochondrial morphology, oxidative stress, autophagy flux, and exosome release in CMECs after AMI. (a) Mitochondrial morphology (bar = 25 μm) and ROS production (bar = 50 μm) in normal and hypoxia-CMECs. The length and aspect ratio of mitochondria were analyzed using the ImageJ software. The fluorescence intensity of DCFH-DA reflects the ROS production and oxidative stress. (b) Immunofluorescence images showing autophagy flux labeled by mCherry-GFP-LC3B in CMECs (bar = 10 μm). (c) Transmission electron microscopic images show more exosomes being released after hypoxia treatment (bar = 100 nm). (d) Western blot analysis shows the effects of hypoxia on the expression of CD63, TSG101, and GEC1. (a) p < 0.05 compared with the normal group, (b) p < 0.05 compared with the hypoxia group.
