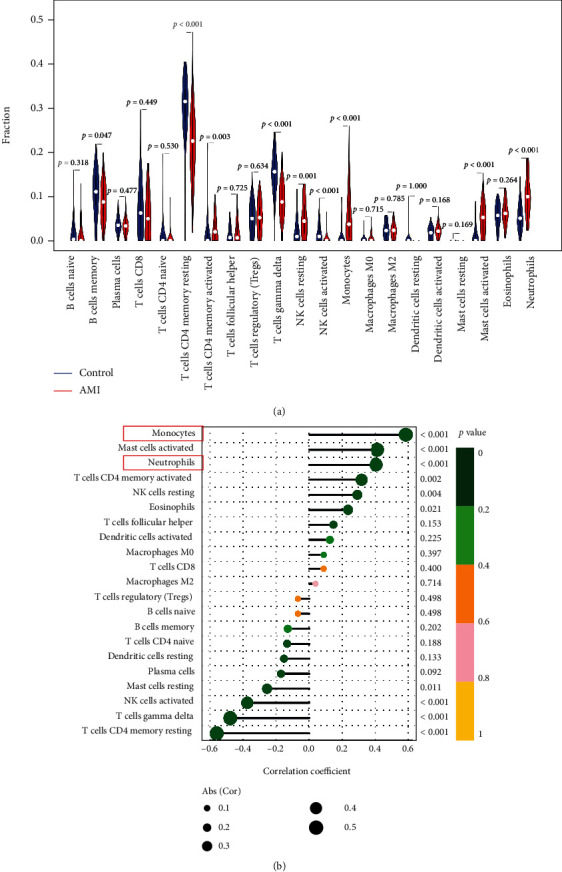
Figure 6.

The relationship between GEC1 expression in blood CECs and immune cell infiltration after AMI. (a) Comparison of 22 immune cell subtypes between AMI and normal tissues. Blue and red colors represent normal and AMI samples, respectively. (b) Correlation analysis between GEC1 and infiltrating immune cells after AMI.
