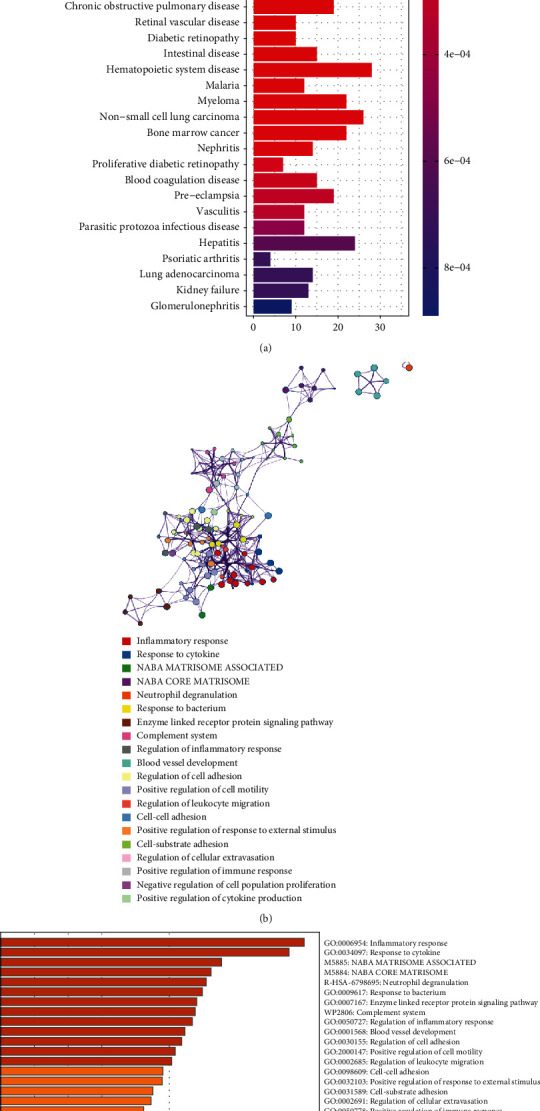
Figure 5.

Disease Ontology (DO) and Metascape analyses of DEGs. (a) DO enrichment analysis was performed on DEGs. The x-axis shows the number of genes enriched on the terms, and the y-axis shows the pathway terms. The q value of each term is colored according to the legend. DEGs are differentially expressed genes. (b) The network of the top 20 enriched term clusters. The color indicates cluster identification, the thickness of the edge indicates the similarity score, and terms with a similarity score> 0.3 are connected by an edge. (c) The top 20 clusters are shown in a heat map. Color is used to indicate cluster identification: the lower the P value, the darker the color.
