Figure 8.

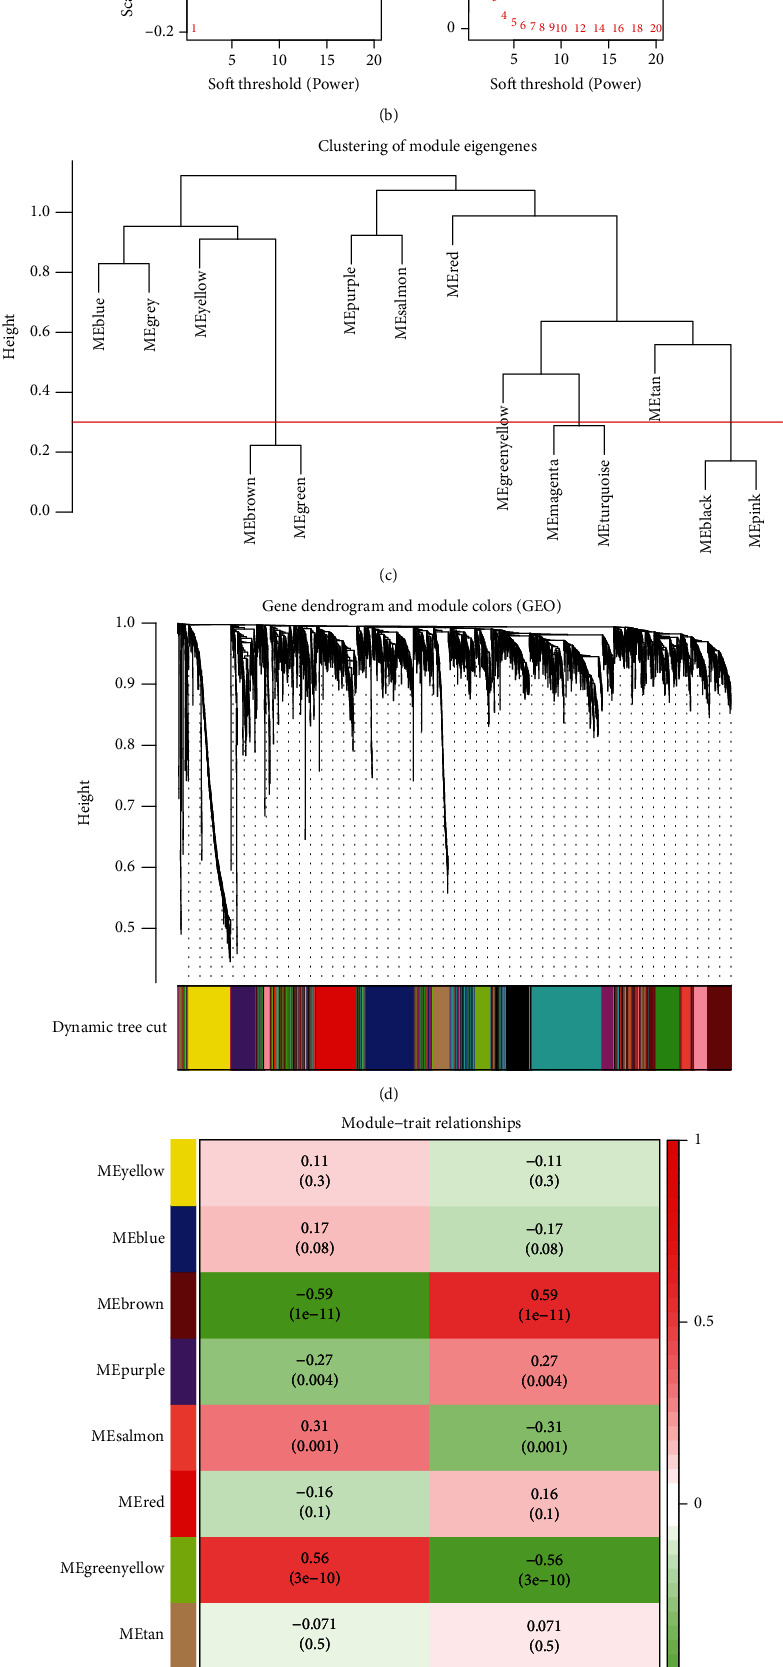
Analysis of the weighted coexpression network in merged dataset. (a) Sample clustering of merged data set. The samples were classified into two clusters that were significantly distinct. Cluster 1 was chosen for further analysis. (b) Selection of optimal thresholds. The threshold is 5. (c) The threshold was set to 0.3 and minimum number of genes per module to 50 to merge modules that are similar in the cluster tree. (d) Different modules are produced and shown in different colors by aggregating genes with strong correlations into a same module. (e) Analysis of correlations between modules and PAH. The brown module was significantly correlated with PAH (r = 0.59; P = 1e − 11) and with normal samples (r = −0.59; P = 1e − 11). (f) Correlation plot between MM (x-axis) and GS (y-axis) of genes contained in the brown module. PAH: pulmonary arterial hypertension.
