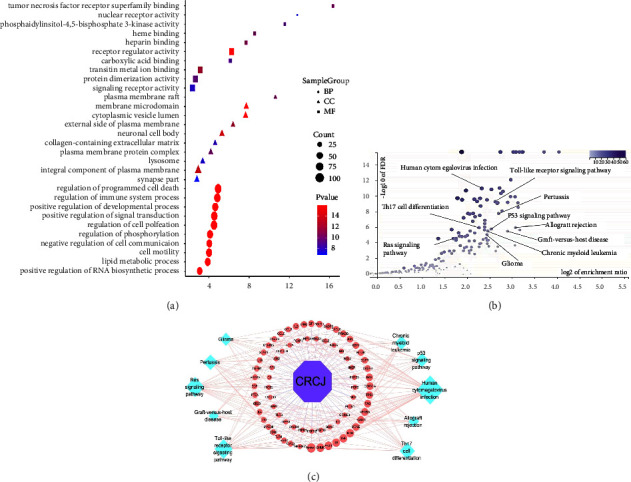
Figure 3.

(a) GO enrichment analysis of the common targets. The top ten GO functional terms in BP, CC, and MF were selected (p < 0.05), respectively. The color represents the p-value, and the size of the spot represents the gene count. (b) KEGG signaling pathway enrichment analysis. The y-axis represents the FDR. The x-axis represents the enrichment ratio. (c) CRCJ-target-pathway network. The purple hexagon shape, pink circles, and blue circles represent the CRCJ, targets, and KEGG pathway, respectively.
