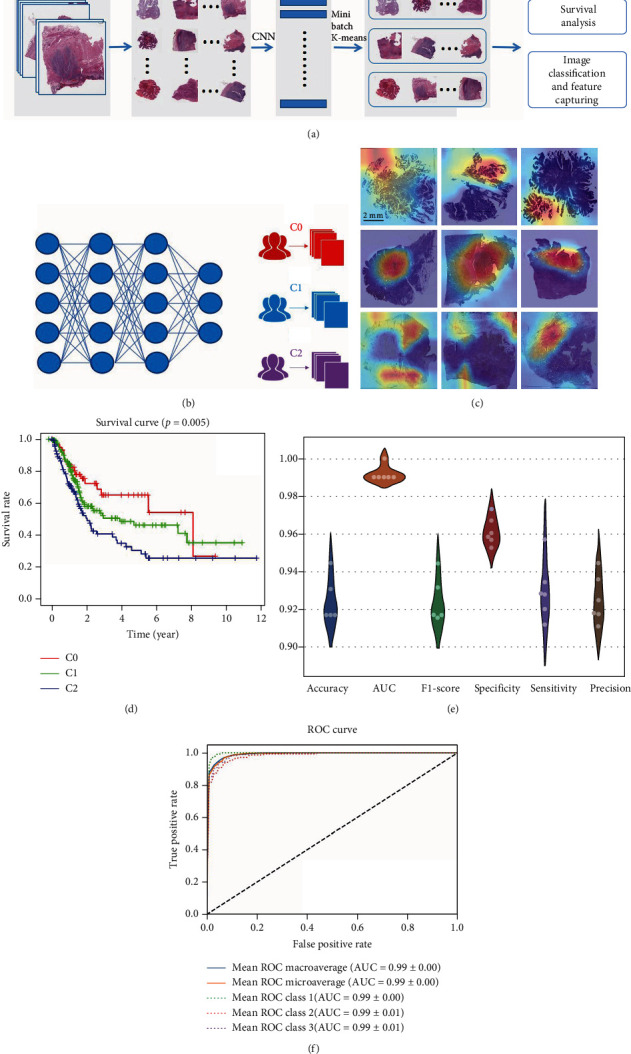
Figure 1.

Overview of the deep learning model. (a) The overall flow chart of developing WSI cluster. (b) The model training for WSI cluster at tie level. (c) Whole slide images of patients with each WSI subtype in TCGA cohort. (d) Survival analysis of WSI cluster (e) The performance of 6-fold cross validation. (f) The average ROC curve of 6-fold cross-validation.
