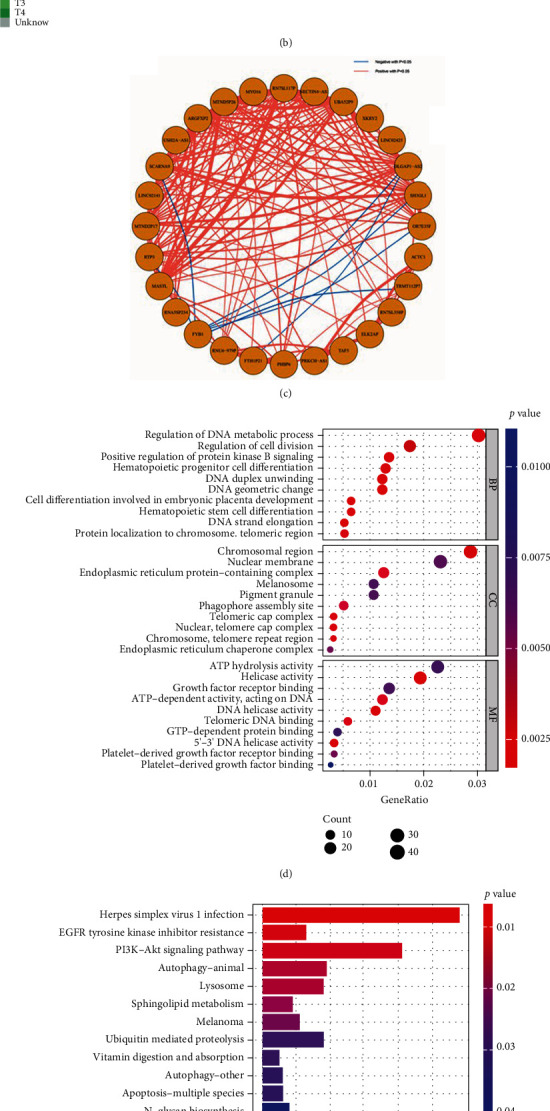
Figure 4.

Developing the AI gene signature, AI score and their functional analyses in the TCGA-BLCA cohort. (a) The flow chart of the AI score algorithm. (b) The heatmap shows the expression of 28 optimal genes (AI signature) between AI clusters. (c) The volcano plot shows the 28 optimal genes, and the correlation between these genes. (d) Gene Ontology (GO) analysis of the AI gene signature. (e) Kyoto Encyclopedia of Genes and Genomes (KEGG) analysis of the AI gene signature. (f) Survival analysis of the AI score cluster. (g) The differences in the AI score between the AI subgroups. (h) ROC curve showed the accuracy of the AI score in predicting prognosis in the TCGA-BLCA cohort.
