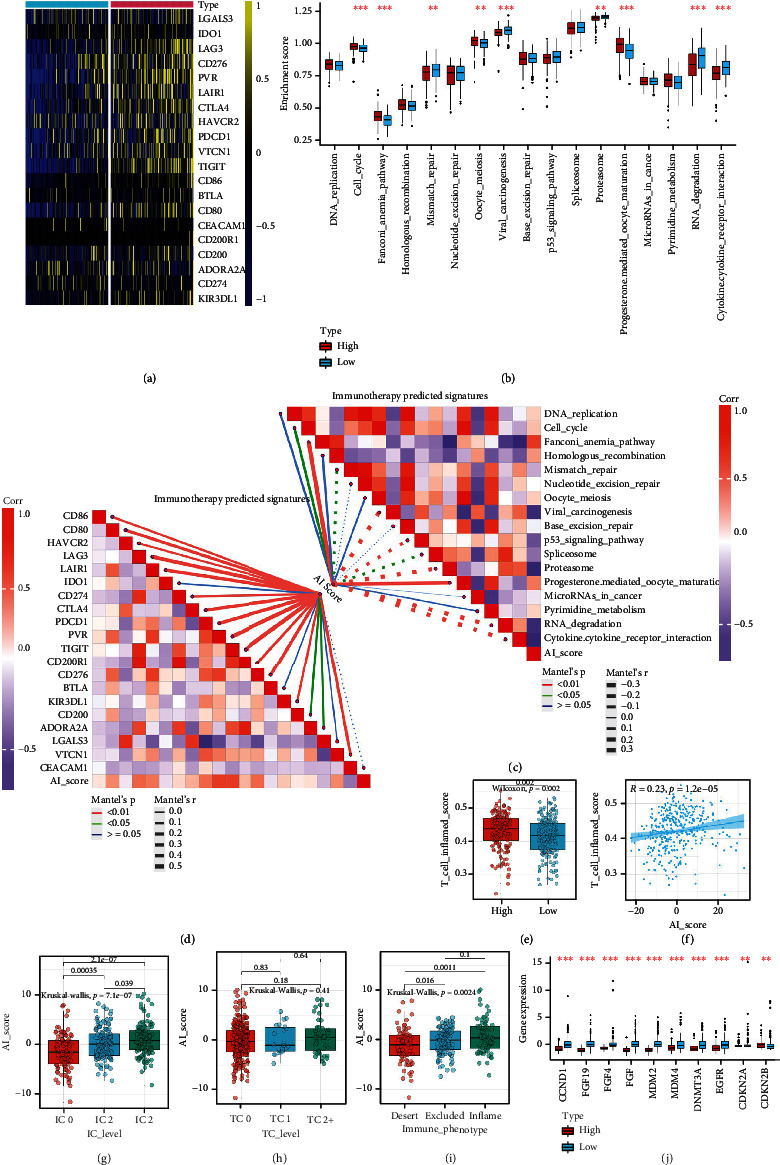
Figure 6.

The AI clusters and AI score correlated with predictors of ICB response in the TCGA-BLCA cohort. (a) The differences in the expression of 22 immune checkpoints between AI clusters. (b) The differences in the enrichment scores of positive ICB response-related signatures between AI clusters. (c, d) The upper right part indicates the correlations between AI score and the enrichment scores of positive ICB response-related signatures; the lower left part shows the correlations between AI score and the expression of 22 immune checkpoints. (e, f) The differences and correlations between AI score and TIS. (g, h) Differences in the PD-L1 expression on tumor cells, and the PD-L1 expression on immune cells between AI clusters in the IMvigor210 cohort. (i) Expression of AI score in all three phenotypes in the IMvigor210 cohort. (j) The difference in mRNA expression of hyperprogression-associated genes between AI clusters. The asterisks indicate a statistically significant P value calculated using the Mann–Whitney U or t-test (∗P < 0.05, ∗∗P < 0.01, and ∗∗∗P < 0.001).
