
Figure 4.
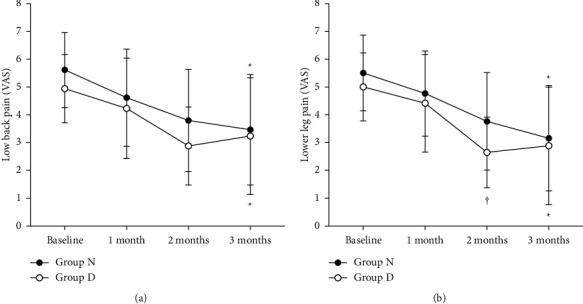
Changes in visual analog scale (VAS) scores of lower back pain (a) and lower leg pain intensity (b) between group D and group N Both groups showed a decrease in lower back pain intensity from baseline to 3 months (p < 0.001). However, lower back pain intensity was not significantly different between the groups at any time. The lower leg pain intensity showed a significant decrease in VAS scores from baseline to 3 months (p < 0.001), and the lower leg pain intensity in group D showed a significantly lower VAS score than that in group N at 2 months (p=0.028). The error bar indicates the standard deviation. ∗Significant at p < 0.001 when compared to the baseline VAS score. †Significant at p < 0.001 between D and N groups.