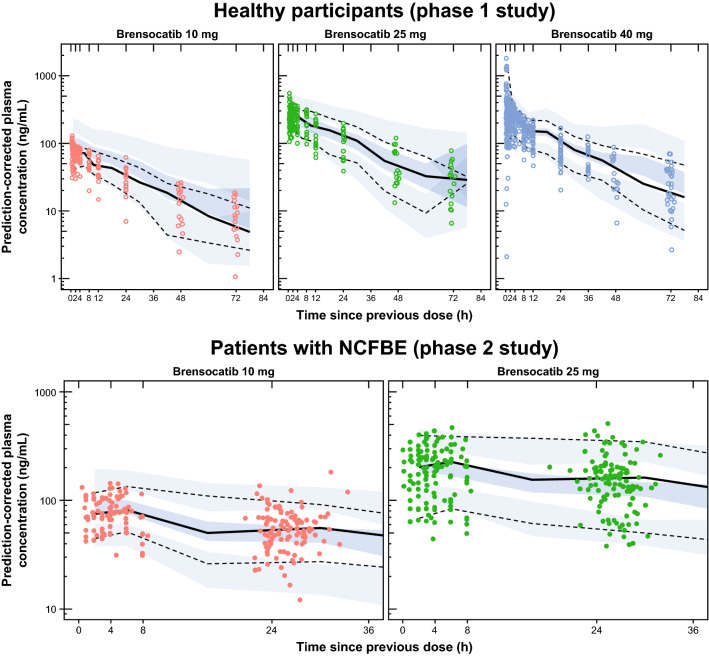
Fig. 2.
Final pooled pharmacokinetic model compared with observed data. The simulation-based diagnostics (pc-VPC plots) indicate that the final model adequately described both the central tendency and the variability in observed brensocatib concentrations over time in healthy participants (top) and in patients with NCFBE (bottom). Dots indicate observed concentrations; solid black lines indicate median observed concentrations; dashed black lines indicate 5th and 95th percentiles of the observed concentrations; blue-shaded regions indicate 90% CIs for the median and 5th and 95th percentiles from the simulations. NCFBE non-cystic fibrosis bronchiectasis, pc-VPC prediction-corrected visual predictive check

