
Figure 1.
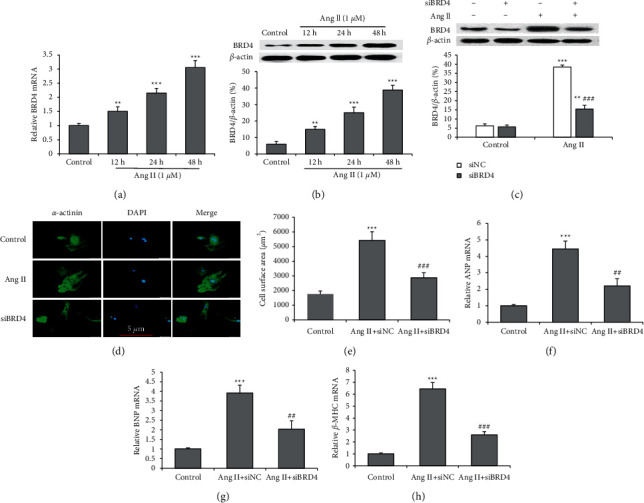
siBRD4 inhibits Ang II-induced cardiomyocyte hypertrophy. Cultured H9c2 cells were treated by vehicle (control) or Ang II (1 μM) for 12, 24, and 48 hours. (a) The mRNA expression level of BRD4 in Ang II-induced H9c2 cells. (b) The protein expression level of BRD4 in Ang II-induced H9c2 cells. (c) The BRD4 expression was silenced using siRNA in H9c2 cells and validated using a Western blot. (d) H9c2 cells were stained with α-actinin (green) and DAPI (blue) to show morphology and size; representative photographs are shown (scale bar: 10 μm). (e) Cardiomyocyte hypertrophy was evaluated by the surface area. mRNA expressions of the ANP (f), BNP (g), and β-MHC (h) genes were evaluated using a real‐time PCR. All data are expressed as mean ± SD, and the experiment was performed three times, ∗∗P < 0.01, ∗∗∗P < 0.001 vs. control group; ###P < 0.001 vs. Ang II + siNC group.