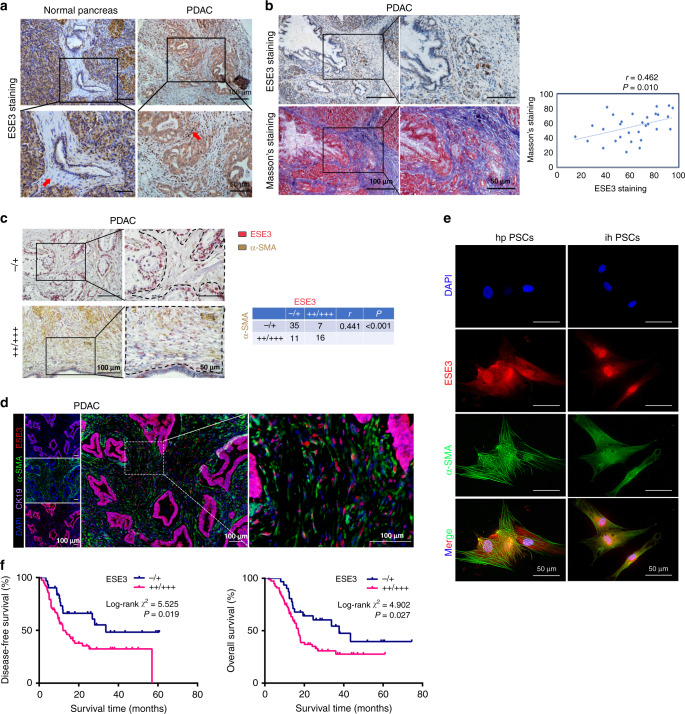
Fig. 1. ESE3 was overexpressed in PSCs and associated with PDAC fibrosis.
a IHC of ESE3 protein expression in PSCs and adjacent normal pancreatic tissues. b IHC and Masson’s trichrome staining in consecutive PDAC tissue sections. c Double immunohistochemical staining and correlation analysis between ESE3 protein expression and extent of stromal fibrosis (α-SMA, stromal marker) in PDAC samples. d Multiplex IF staining of ESE3 (red), α-SMA (green) and cytokeratin (CK-19, an epithelial marker, purple) in PDAC samples. e IF staining of ESE3 and α-SMA expression in hpPSCs and ihPSCs. f Association of ESE3 expression in PSCs with DFS (left) and OS (right) in PDAC.

