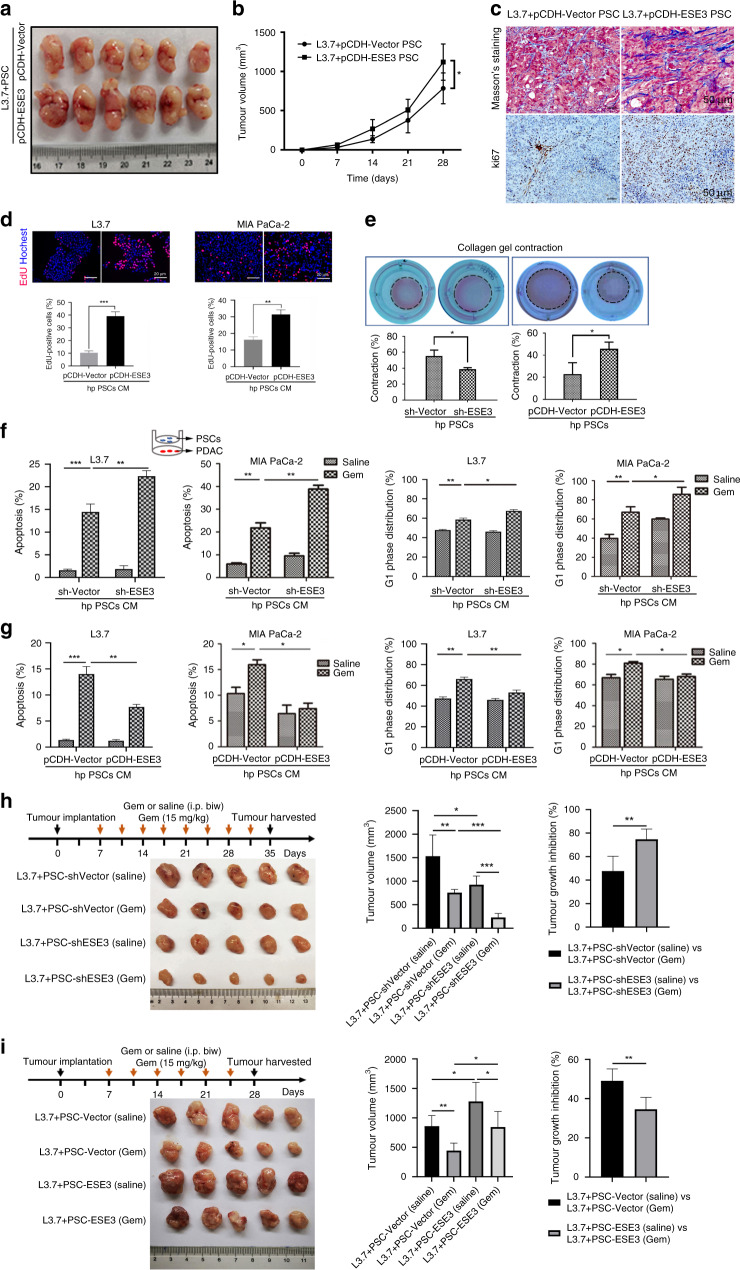
Fig. 2. ESE3 (PSCs) drove PDAC proliferation and chemoresistance in vitro and in vivo.
a Representative images of ihPSCs and PDAC cells (1:1) subcutaneously implanted into the nude mice (nu/nu). b Curves of tumour growth are expressed as mean ± SD with different groups. c Masson’s trichrome staining and Ki-67 staining analysis of the extent of stromal fibrosis and cell proliferation in mouse xenograft samples from different groups. d EdU experiment evaluation of the proliferation of L3.7 and MIA-PaCa-2 cells cultured with the CM of pCDH-ESE3/pCDH-Vector hpPSCs for 48 h. e Representative images from the 3D collagen gel contractility assay showing the contractility of sh-ESE3/sh-Vector hpPSCs (left) and pCDH-ESE3/pCDH-Vector hpPSCs (right) after 72 h. Flow cytometry was performed to analyse the apoptosis and G1-phase distribution of L3.7 and MIA-PaCa-2 cells indirectly co-cultured with sh-ESE3/sh-Vector hpPSCs (f) or pCDH-ESE3/pCDH-Vector hpPSCs (g) and then treated with Gem (2 μM) for 24 h. h L3.7+sh-Vector or sh-ESE3 ihPSCs (1:1) subcutaneously injected into nude mice treated with Gem or saline. Representative images, tumour volume and tumour growth inhibition are listed. i L3.7+pCDH-Vector or pCDH-ESE3 ihPSCs (1:1) subcutaneously injected into nude mice treated with Gem. Representative images, tumour volume and tumour growth inhibition are listed. *P < 0.05, **P < 0.01 and ***P < 0.001.

