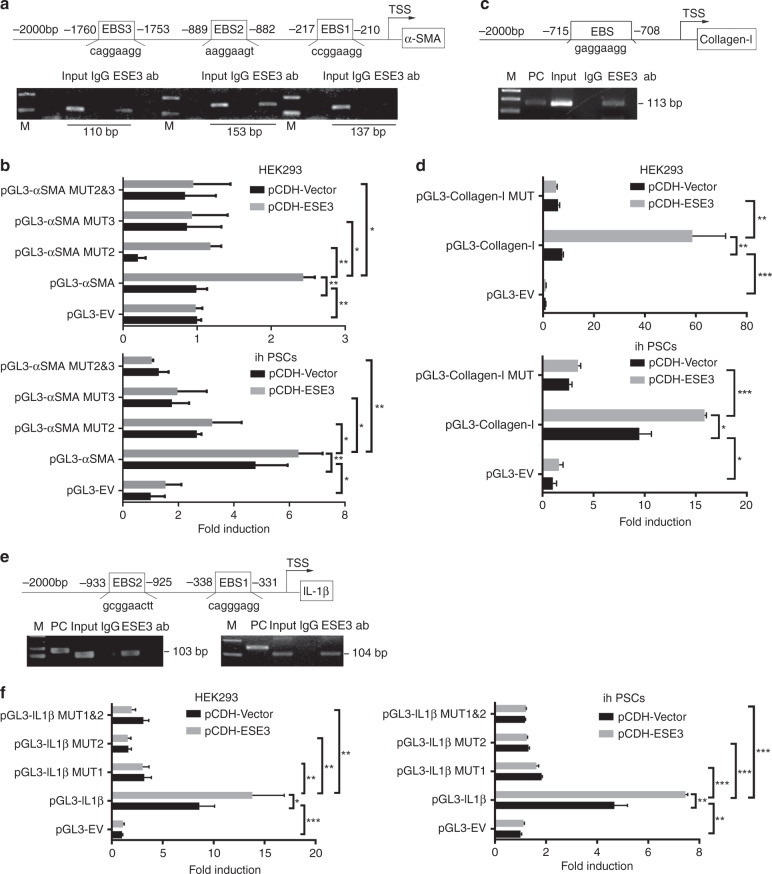
Fig. 4. ESE3 directly bound to the promoter regions of α-SMA, collagen-I and IL-1β to upregulate their expression in PSCs.
Schematic of the structures of the α-SMA (a), collagen-I (c) and IL-1β (e) gene promoters. Shown are the EBSs and their location (upper). ChIP analyses of ESE3 binding to the α-SMA (a), collagen-I (c) and IL-1β (e) promoters in ihPSCs (lower). Luciferase assay-based promoter activity analysis of the HEK293 and ihPSCs overexpressing ESE3 (pCDH-ESE3) and the control (pCDH-Vector) cells transfected with pGL3-α-SMA (b), pGL3-collagen-I (d), pGL3-IL-1β (f), pGL3-Empty Vector (pGL3-EV) and pGL3-Mutations (pGL3-MUT). The cells were subjected to dual-luciferase analysis 48 h after transfection. The results are expressed as fold induction relative to that in the corresponding cells transfected with the control vector after the normalisation of firefly luciferase activity according to Renilla luciferase activity. Data are expressed as means ± SD from three independent experiments. M means marker. *P < 0.05, **P < 0.01 and ***P < 0.001.

