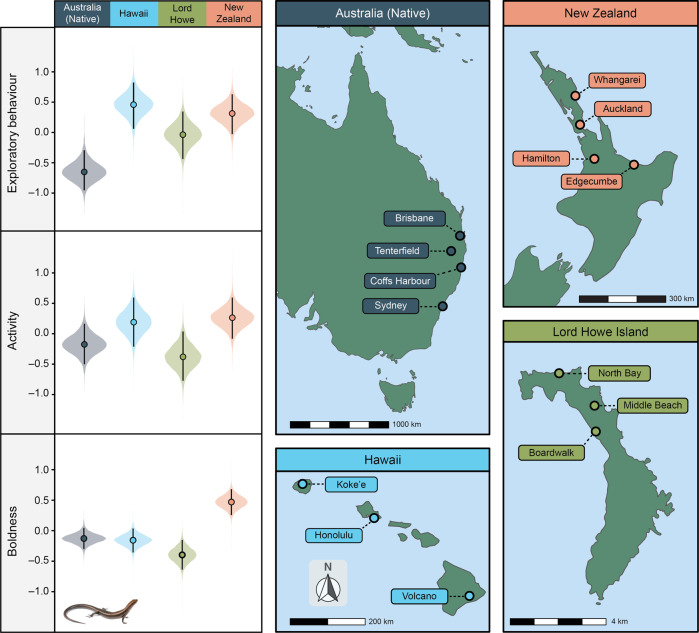
Fig. 1. Schematic diagrams of both native (Australia) and invasive (Hawaii, Lord Howe Island, and New Zealand) delicate skink populations collected in this study.
Result plots show average regional differences in exploratory behavior (i.e., time spent exploring the barrier), activity (i.e., the number of transitions between grid squares), and boldness (i.e., re-emergence latency; axis inverted) between Australia (grey; n = 167 skinks), Hawaii (blue; n = 118), Lord Howe Island (green; n = 92), and New Zealand (pink; n = 143). Boldness scores were inverted so that higher values represent bolder lizards. All behavioral scores are presented in standardized units. For each results graph, filled circles represent posterior medians, vertical error bars denote 95% credible intervals, and plot width represents probability density. Source data are provided as a Source Data file.

