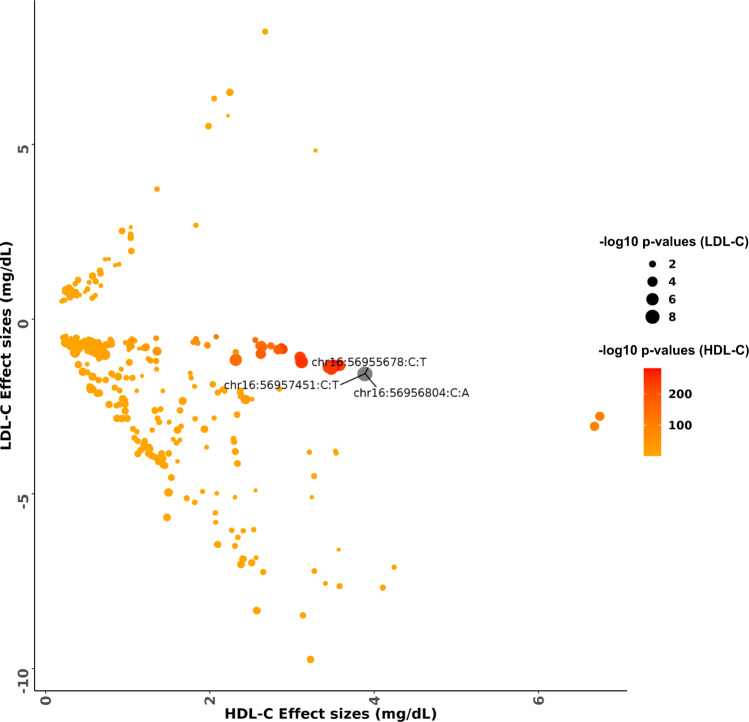
Fig. 3. Comparison of effects estimates for HDL-C and LDL-C among variants in the CETP locus.
The color scale of the data points was based on −log10 p-values from HDL-C association and the size of each data point was based on −log10 p-values of LDL-C association. Variants which are genome wide significant with LDL-C are represented as chromosome:position:reference allele:alternate allele. The effect estimates and p-values were calculated from two-sided genetic association testing preformed using SAIGE-QT model, where the model was adjusted for all the covariates; see Methods. HDL-C high-density lipoprotein cholesterol, LDL-C low-density lipoprotein cholesterol.

