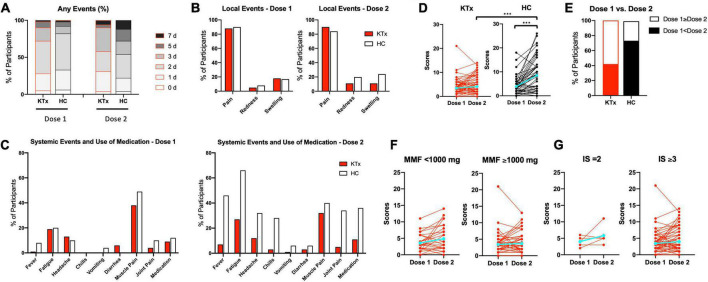
FIGURE 1.
Local and systemic adverse reactions after each vaccination, as recorded by KTx recipients and HCs. (A) Comparison how many days KTx recipients and HCs suffered from any local or systemic adverse events after D1 and D2 vaccination. Day 0 is the day of vaccination. (B,C) Incidence of local (B) and systemic (C) adverse events. (D) Comparison of ‘Yes’ or ‘No’ scores and change in groups. (E) Percentage of scores D1 < D2 or D1 ≥ D2 in each group. (F,G) Comparison of scores and change with regard to MMF dose (F) and number of immunosuppressive drugs (G) in KTx recipients. Blue lines represent means. Data were analyzed using the Mann-Whitney U test (***P < 0.001).

