FIGURE 4.
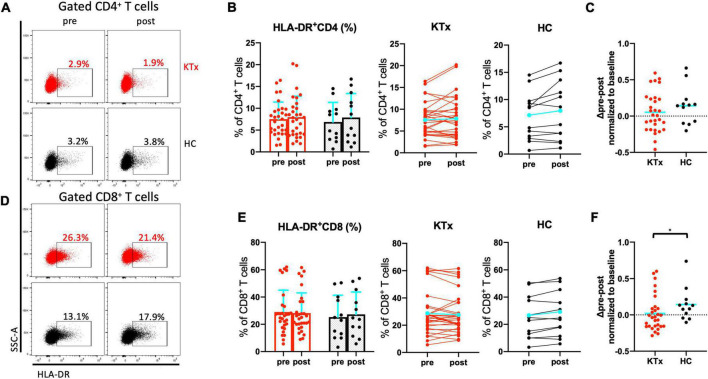
Activated CD8+ T cells were induced by SARS-CoV-2 mRNA vaccination in HCs. Representative gating strategies and scatter plots of activated HLA-DR+, PD1+, and Treg cells among T cell subsets in the two groups pre- and post-vaccination (A,D). Comparison of the proportions and change in proportions of HLA-DR+ cells among CD4+ (B) and CD8+ (E) T cells in KTx recipients (left) and HCs (right) as measured by flow cytometry. Normalized increases in HLA-DR+ cells among CD4+ (C) and CD8+ (F) T cells between pre- and post-vaccination. Bar plots depict mean ± SD. Blue lines and bars represent means. Data were analyzed using the Mann-Whitney U test (*P < 0.05).

