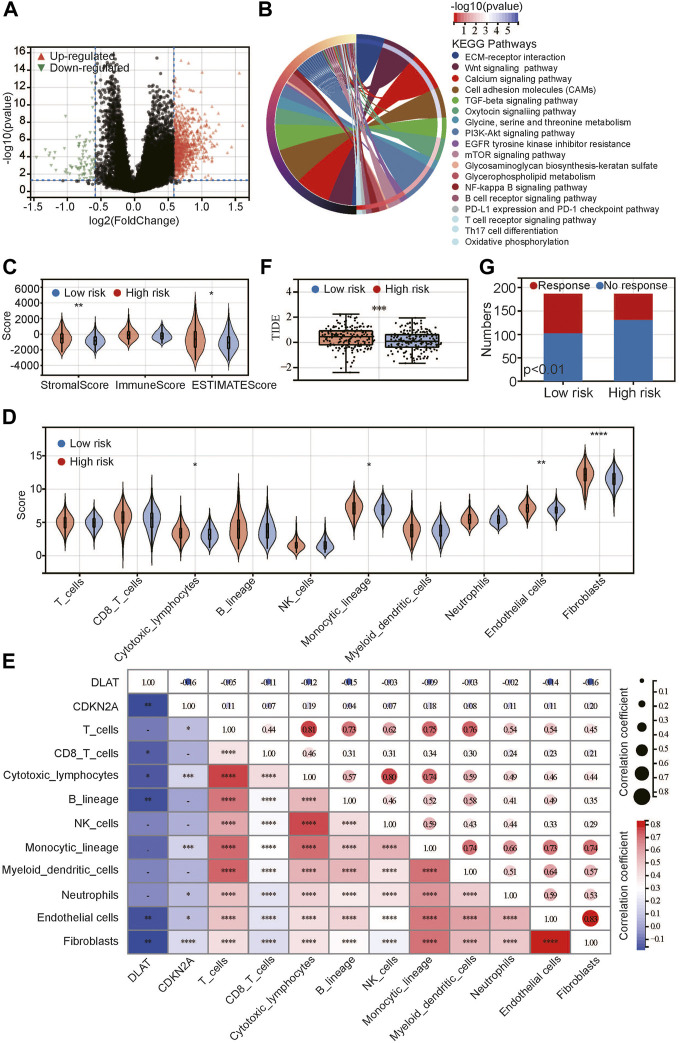
FIGURE 5.
Relationship between risk score and immune/stromal infiltration. (A) Volcano plot of differentially expressed genes; (B) KEGG pathway enrichment between low- and high-risk groups; (C,D) Difference between low- and high-risk groups by ESTIMATE (C) and MCP-Counter (D) algorithms; (E) Correlation between CRGs and immune-related scores; (F) Difference between low- and high-risk groups in TIDE score; (G) Predicted response for immunotherapy. *p < 0.05, **p < 0.01, ***p < 0.001, ****p < 0.0001.

