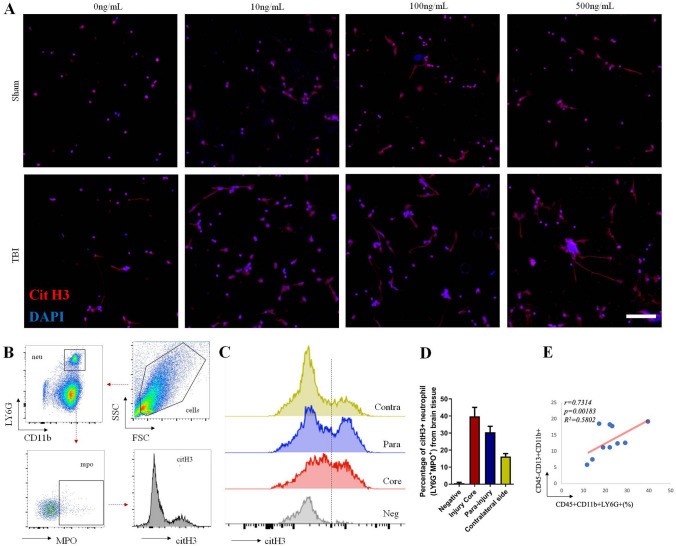
Fig. 3.
NET formation after TBI. A Immunofluorescence of NET formation in peripheral blood. The neutrophils were isolated from peripheral blood of Sham and TBI mice at 24 h post-injury. Then they were treated with gradient concentrations of PMA (10, 100, and 500 ng/mL) for 6 h and stained with Cit H3 (red) and DAPI (blue) (scale bar 100 μm). B Flow cytometric diagram of NET formation (CitH3+LY6G+MPO+) in brain tissue. C Cit H3 levels in MPO+ neutrophils from different brain tissues post-TBI. Negative for LY6G+MPO+ neutrophils without Cit H3 antibody staining. Brain tissues were collected from the injury core, the para-injury area, and the contralateral side of TBI mice. D Quantification of Cit H3-positive neutrophils in C. Each bar represents 3 individual experiments. Data are shown as the mean ± SEM. E Correlation analysis between percentage of neutrophils and CD11b+ pericyte frequency in damaged brain (n = 10).

