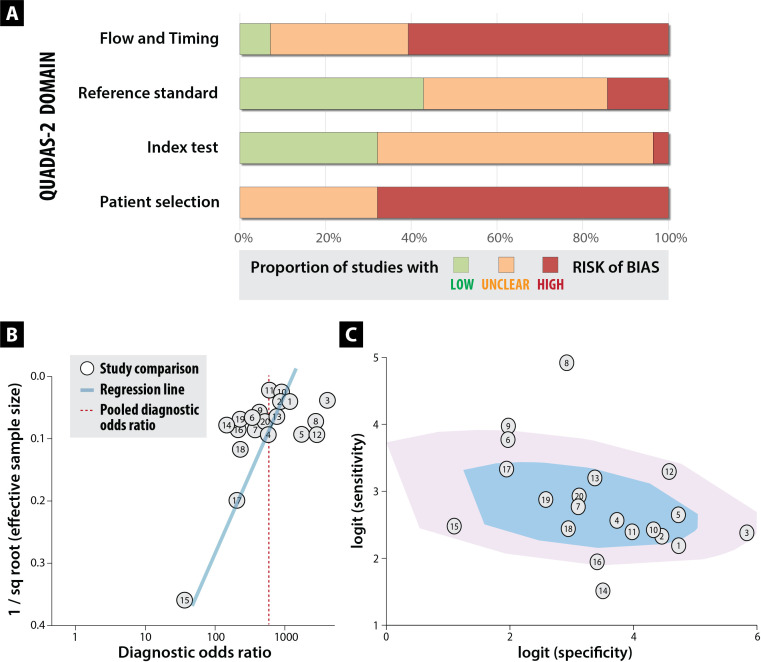
Figure 2.
Risk of bias, publication bias and heterogeneity. Top panel (A; bar chart) shows the overall risk of bias based on QUADAS-2 criteria (see online supplemental table S4 for each study). Bottom panel demonstrates high likelihood of publication bias (B; weighted funnel plot) and study heterogeneity (C; bivariate box plot with the inner shaded area representing the median distribution of sensitivity and specificity, and the outer area the 95% confidence bound). See table 3 for numbers linking to each study comparison.

