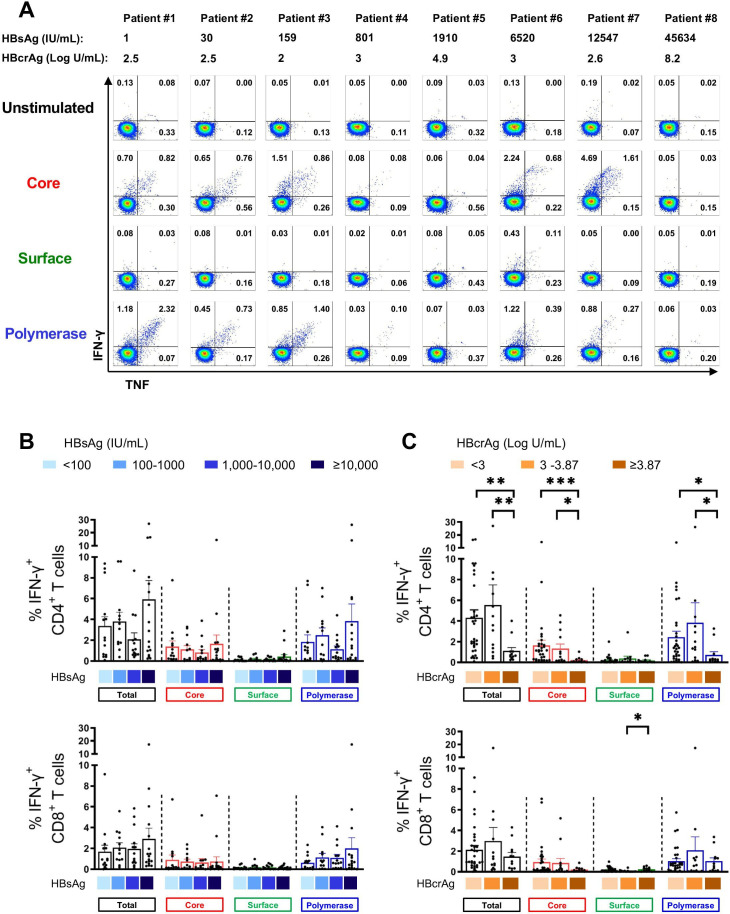
Figure 2.
HBV-specific CD4+ and CD8+ T cell responses in patients with different levels of HBsAg and HBcrAg. HBV-specific CD4+ and CD8+ T cell responses following 10-day in vitro stimulation with HBV overlapping peptide pools. (A) Representative flow cytometry plots of HBV-specific CD4+ T cell responses from patients with different levels of HBsAg and HBcrAg. (B–C) HBV-specific IFN-γ+ CD4+ and IFN-γ+ CD8+ T cells from 57 patients with CHB categorised based on their HBsAg (B) and HBcrAg (C) levels (total-specific T cell response: sum of 14 peptide pools). Statistical significance between each of the two groups was tested by Mann-Whitney test for non-parametric data and by unpaired t-test for parametric data (B–C). *p<0.05; **p<0.01; ***p<0.001. CHB, chronic hepatitis B; HBcrAg, hepatitis B core-related antigen; HBsAg, hepatitis B surface antigen; IFN, interferon; TNF, tumour necrosis factor.

