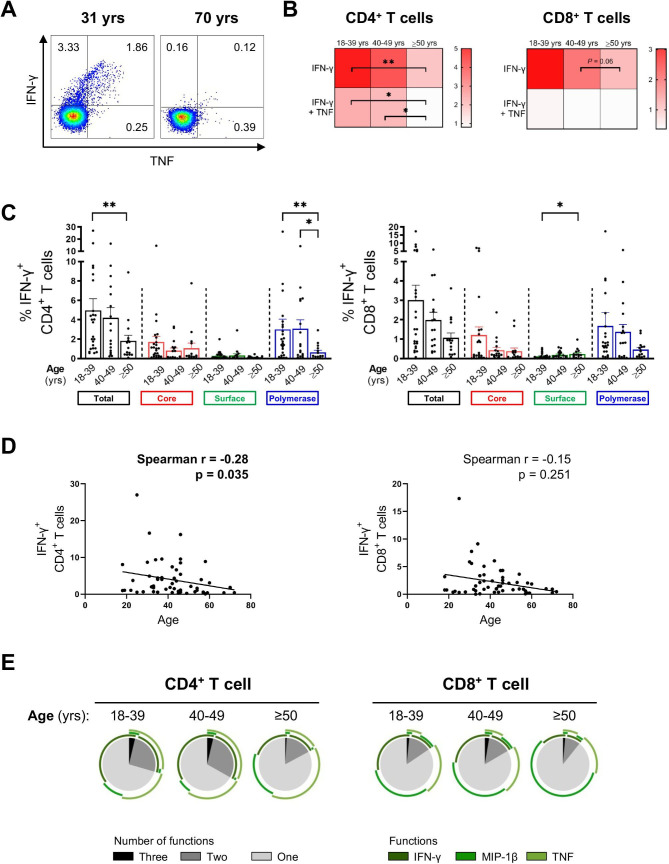
Figure 3.
HBV-specific CD4+ and CD8+ T cell responses in different age groups. HBV-specific CD4+ and CD8+ T cell responses following 10-day in vitro stimulation with HBV overlapping peptide (OLP) pools grouped according to the patients’ age. (A) Representative flow cytometry plots of HBV core-specific IFN-γ+/TNF+ CD4+ T cell responses of two patients. (B) Heat map showing mean of frequencies of total cytokine+ HBV-specific CD4+ and CD8+ T cells (age groups: 18–39, n=25; 40–49, n=17; ≥50, n=15). (C) IFN-γ+ HBV-specific CD4+ and CD8+ T cells of different age groups. (D) Correlation analyses of age with frequencies of total IFN-γ+ CD4+ and CD8+ T cells. (E) Mean percentages of multifunctional CD4+ and CD8+ T cell responses after in vitro expansion with total HBV OLPs (sum of 14 OLP pools). Statistical significance between each of the two groups was tested by Mann-Whitney test for non-parametric data and by unpaired t-test for parametric data (B–C). *p<0.05; **p<0.01. IFN, interferon; TNF, tumour necrosis factor.

